Google Cloud Platform 模块
编辑Google Cloud Platform 模块
编辑此模块使用 Stackdriver Monitoring API 定期从 Google Cloud Platform 获取 Google Cloud Platform 服务的监控指标。
此模块可能会产生额外的 Stackdriver Monitoring API 请求费用。有关更多详细信息,请参阅 API 调用次数的粗略估计。
模块配置和参数
编辑这是您可以调整的可能的模块参数列表
-
zone: 一个字符串,表示您要监控的区域,例如
us-central1-a。或者,您可以指定部分区域名称,如us-central1-或us-central1-*,这将监控所有以us-central1-开头的区域:us-central1-a、us-central1-b、us-central1-c和us-central1-f。请参阅 GCP 区域,了解 GCP 中可用的区域。 -
region: 一个字符串,表示您要监控的区域,例如
us-central1。这将启用对该区域下所有区域的监控。或者,您可以指定部分区域名称,如us-east或us-east*,这将监控所有以us-east开头的区域:us-east1和us-east4。如果同时配置了区域和专区,则仅使用区域。请参阅 GCP 区域,了解 GCP 中可用的区域。如果未指定region和zone,则将从所有区域/专区收集指标。 - project_id: 一个字符串,表示您的 GCP 项目 ID
- credentials_file_path: 一个字符串,指向 Metricbeat 可以访问的、您使用 IAM 创建的 JSON 文件路径。
-
exclude_labels: (
true/false默认值false) 不要从指标集中提取额外的标签和元数据信息,仅获取指标。目前,仅在compute指标集中支持标签和元数据提取。 - period: 一个时间持续时间,用于指定此模块的收集频率。
- endpoint: 一个自定义端点,用于 GCP API 调用。如果未指定,将使用默认端点。
配置示例
编辑-
启用
compute指标集以从elastic-observability项目的us-central1-a区域收集指标。- module: gcp metricsets: - compute zone: "us-central1-a" project_id: "elastic-observability" credentials_file_path: "your JSON credentials file path" exclude_labels: false period: 60s -
启用
compute和pubsub指标集以从elastic-observability项目的us-central1区域下的所有区域收集指标。- module: gcp metricsets: - compute - pubsub region: "us-central1" project_id: "elastic-observability" credentials_file_path: "your JSON credentials file path" exclude_labels: false period: 60s -
启用
compute指标集以从elastic-observability项目中以us-west开头的所有区域收集指标,其中包括us-west1、us-west2、us-west3和us-west4下的所有区域。- module: gcp metricsets: - compute - pubsub region: "us-west" project_id: "elastic-observability" credentials_file_path: "your JSON credentials file path" exclude_labels: false period: 60s
身份验证、授权和权限。
编辑可以使用多种方式在 Google Cloud Platform 中实现身份验证和授权。对于当前版本的 Metricbeat Google Cloud Platform 模块,唯一支持的方法是使用服务帐户 JSON 文件。一个带有私钥的典型 JSON 如下所示
凭据示例
编辑{
"type": "service_account",
"project_id": "your-project-id",
"private_key_id": "a_private_key_id",
"private_key": "-----BEGIN PRIVATE KEY-----your private key\n-----END PRIVATE KEY-----\n",
"client_email": "some-email@your-project-id.iam.gserviceaccount.com",
"client_id": "123456",
"auth_uri": "https://127.0.0.1/o/oauth2/auth",
"token_uri": "https://oauth2.googleapis.com/token",
"auth_provider_x509_cert_url": "https://www.googleapis.com/oauth2/v1/certs",
"client_x509_cert_url": "https://www.googleapis.com/robot/v1/metadata/x509/metricbeat-testing%40your-project-id.iam.gserviceaccount.com"
}
通常,您必须创建一个服务帐户并为其分配以下角色或每个角色中描述的权限(适用于所有指标集)
-
Monitoring Viewer:-
monitoring.metricDescriptors.list -
monitoring.timeSeries.list
-
-
Compute Viewer:-
compute.instances.get -
compute.instances.list
-
您可以在 IAM 中使用您的服务帐户和对您的资源的实例级访问权限(例如,允许在实例中运行的所有内容被授权使用 Compute API)。该模块使用 Google Cloud Platform 库进行身份验证,因此有很多可能性,但该模块仅支持使用上述方法。
Google Cloud Platform 模块:幕后
编辑Google Cloud Platform 提供 Stackdriver Monitoring API 以从其服务中获取指标。这些指标是逐个检索的。
如果您还想提取服务标签(通过将 exclude_labels 设置为 false,这是默认状态)。您还需要对相应的服务进行新的 API 检查。服务标签需要新的 API 调用来提取这些指标。在最坏的情况下,API 调用次数将翻倍。在最好的情况下,所有指标都来自同一个 GCP 实体,并且 100% 的所需信息都包含在第一次 API 调用中(该调用会缓存以用于后续调用)。
如果 period 值设置为 5 分钟,并且指标类型的采样周期为 60 秒,则此模块将每 5 分钟使用聚合从该指标类型收集一次数据。GCP 监控数据具有高达 240 秒的延迟,这意味着最新的监控数据将最多延迟 4 分钟。有关更多详细信息,请参阅 GCP 监控指标数据的延迟。在 gcp 模块中,指标是根据此引入延迟收集的,该延迟也从 ListMetricDescriptors API 获取。
API 调用次数的粗略估计
编辑Google Cloud Platform 的定价取决于您对其 API 发出的请求次数。在这里,您可以找到一些信息,您可以使用这些信息来估计您应该期望的定价。例如,假设您激活了一个 Compute Metricset,并且您不想排除标签。您在特定的 GCP 项目、区域和专区中总共有 20 个实例正在运行。
例如,如果 Compute Metricset 获取 14 个指标(这是早期测试版中获取的指标数量)。这些指标中的每一个都将尝试对 Compute API 进行 API 调用以检索其元数据。因为您有 20 个不同的实例,所以在每次刷新期间将完成的 API 调用总数为:14 个指标 + 20 个实例 = 每 5 分钟 34 个 API 请求(如果这是您当前的周期)。每天一个专区有 9792 个 API 请求。如果您再添加 2 个具有相同实例数量的专区,则每天将有 19584 个 API 请求(每个专区 9792 个),或者 Compute Metricset 每月大约有 587520 个 API 请求。此计算必须针对每个不同的 Metricset 进行,并且略有变化。
指标集
编辑目前,在 gcp 模块中,我们有 billing、compute、gke、loadbalancing、pubsub、metrics 和 storage 指标集。
billing
编辑此指标集从 GCP BigQuery 获取账单指标。Cloud Billing 允许用户全天自动将账单数据导出到 BigQuery 中。此指标集定期访问每日成本详细信息表,以导出账单指标以供进一步分析。
billing 指标集附带一个预定义的仪表板

compute
编辑此指标集从 Google Cloud Platform 中的 Compute Engine 虚拟机获取指标。compute 指标集包含从 GCP Compute Monitoring API 导出的一些指标。额外标签和元数据也使用 Compute API 提取。这足以获取与指标关联的大部分信息,例如计算标签和元数据以及指标特定标签。
compute 指标集附带一个预定义的仪表板

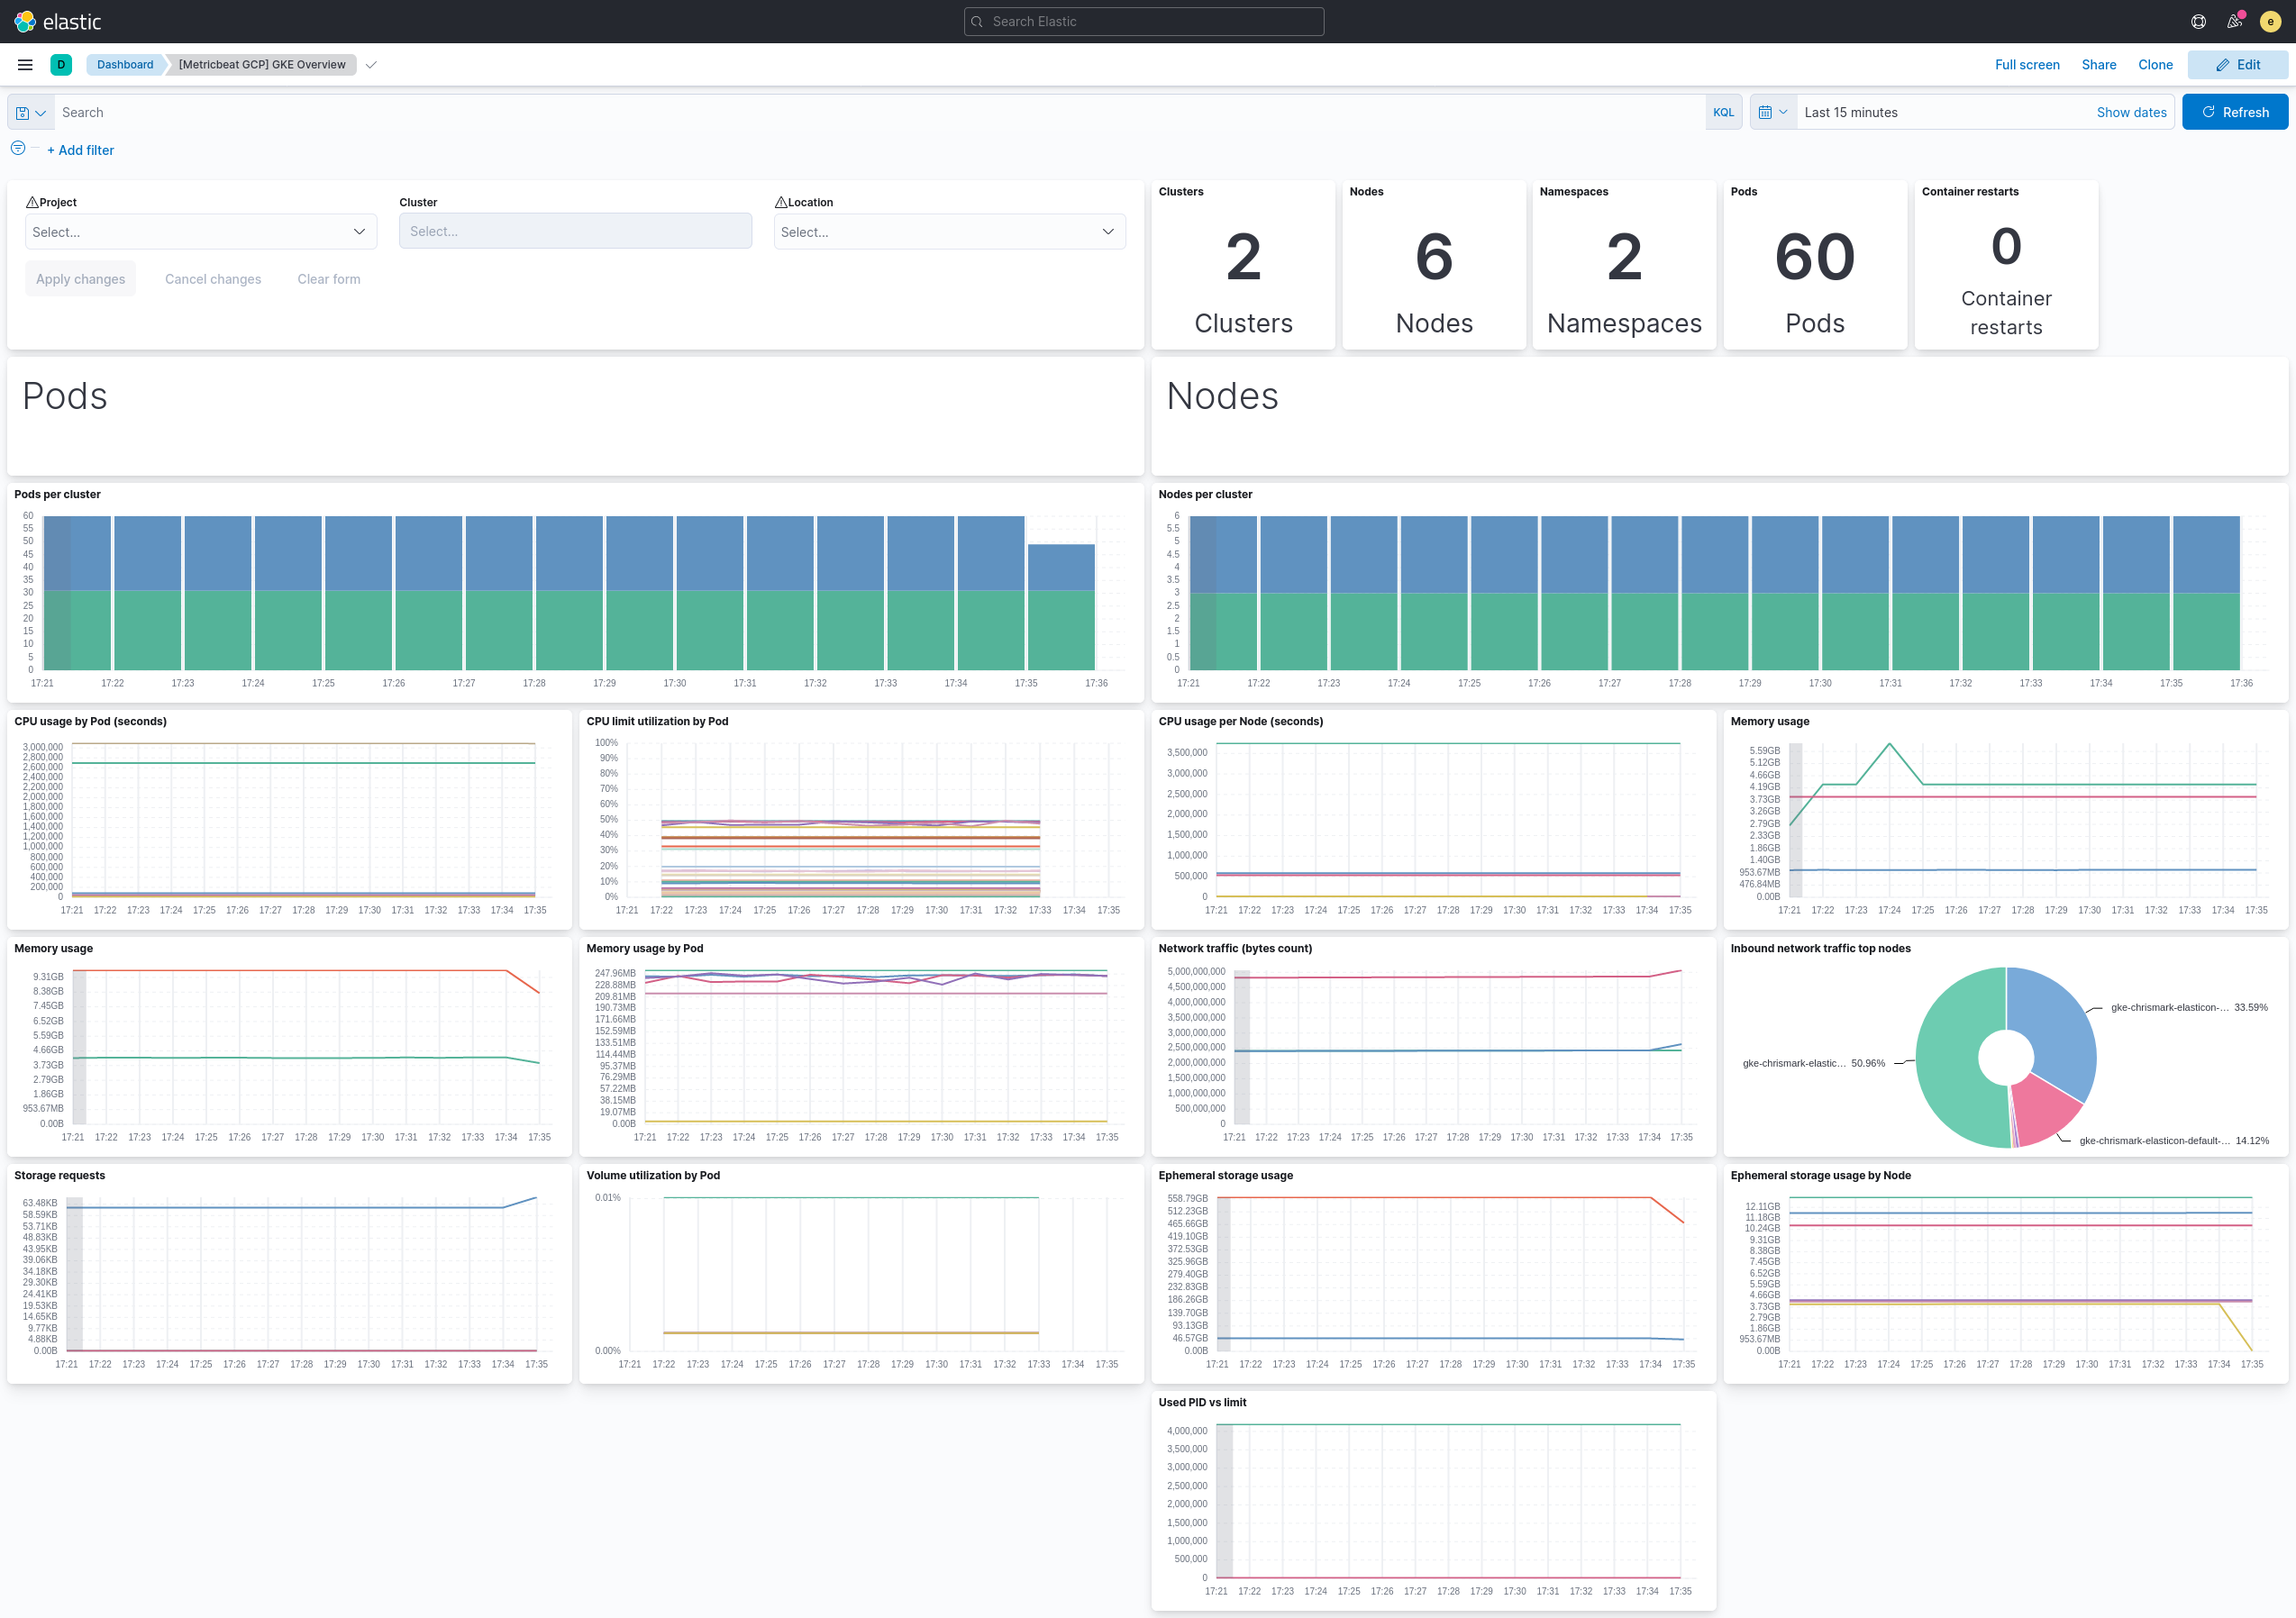
gke
编辑此指标集获取 Kubernetes Engine 的指标。
gke 指标集包含 Cloud Monitoring Kubernetes 指标 导出的所有 GA 指标。
额外标签和元数据也使用 Compute API 提取。
gke 指标集附带一个预定义的仪表板
loadbalancing
编辑此指标集从 Google Cloud Platform 中的负载均衡服务中获取指标。loadbalancing 指标集包含从GCP 负载均衡监控 API 导出的所有指标。
loadbalancing 指标集带有两个预定义的仪表板
HTTPS
编辑对于 HTTPS 负载均衡: image::./images/metricbeat-gcp-load-balancing-https-overview.png[]
L3
编辑对于 L3 负载均衡: image::./images/metricbeat-gcp-load-balancing-l3-overview.png[]
TCP/SSL/代理
编辑对于 TCP/SSL/代理 负载均衡: image::./images/metricbeat-gcp-load-balancing-tcp-ssl-proxy-overview.png[]
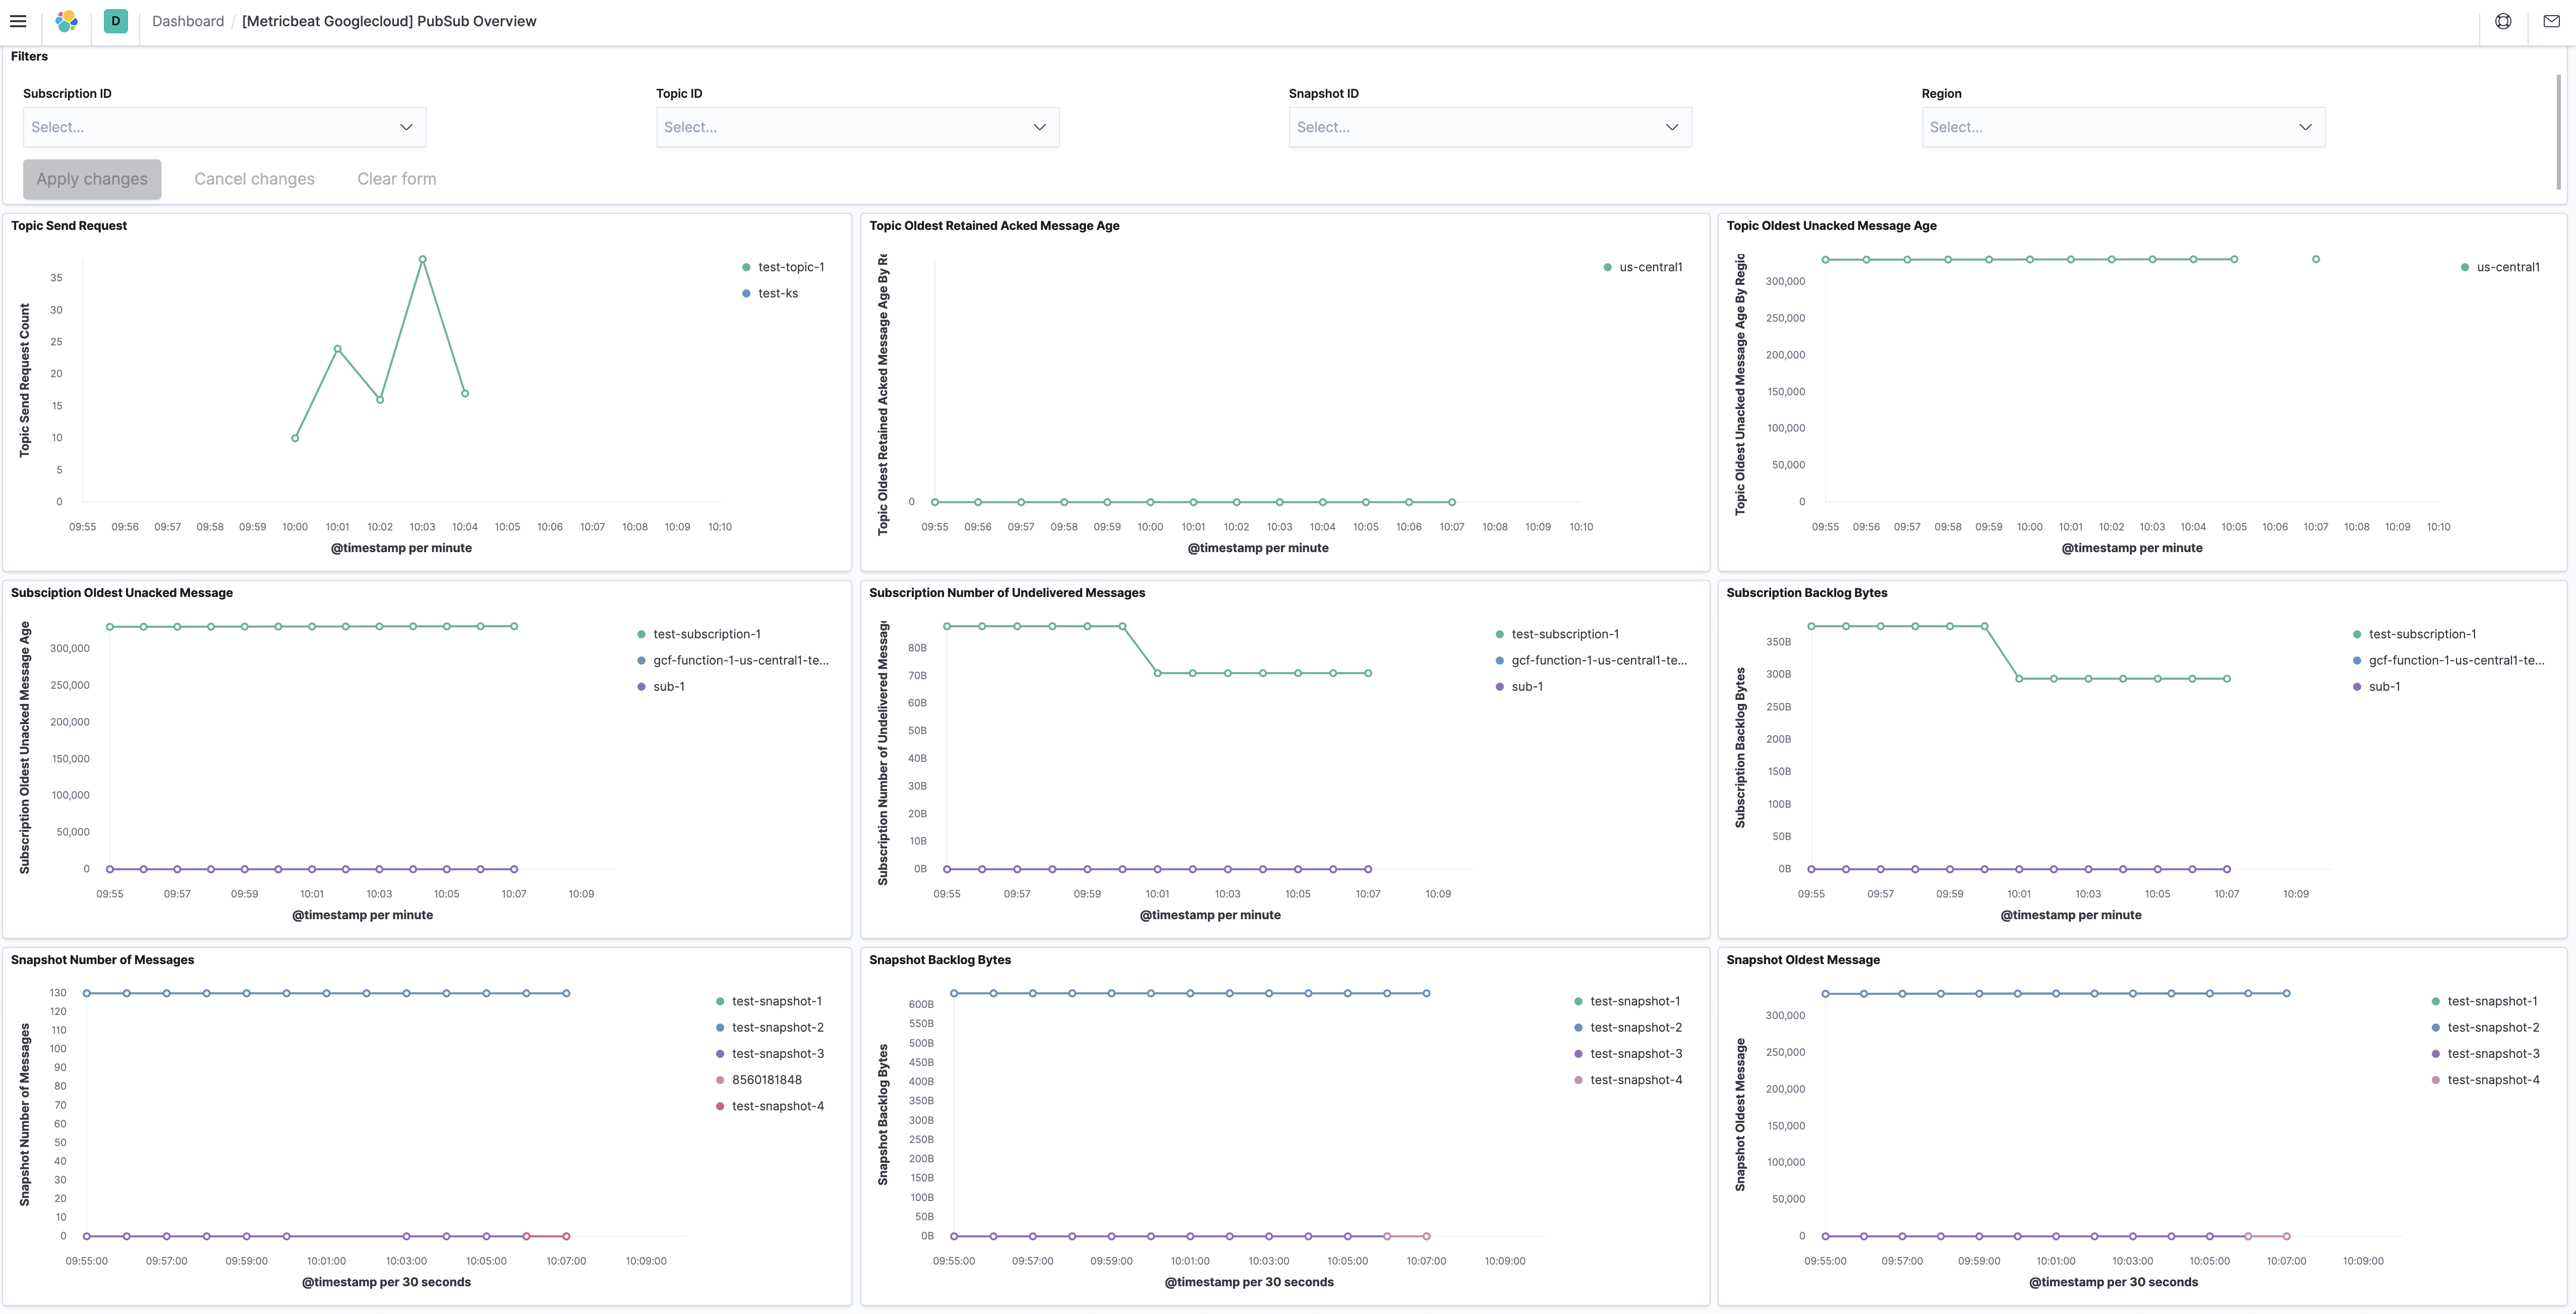
pubsub
编辑此指标集从 Google Cloud Platform 中的 Pub/Sub 主题和订阅中获取指标。pubsub 指标集包含从 GCP Pub/Sub 监控 API 导出的所有 GA 阶段指标。
pubsub 指标集带有一个预定义的仪表板
metrics
编辑metrics 指标集使用 Google Cloud Operations/Stackdriver,它提供了云驱动应用程序的性能、正常运行时间和整体运行状况的可见性。它从 Google Cloud 的不同服务收集指标、事件和元数据。此指标集用于使用 ListTimeSeries API 从 Google Cloud 收集监控指标。
storage
编辑此指标集从 Google Cloud Platform 中的存储服务中获取指标。storage 指标集包含从 GCP 存储监控 API 导出的所有 GA 指标。
我们建议用户为此指标集定义 period: 5m,因为在 Google Cloud 中,存储监控指标每 5 分钟的采样周期写入一次,并有 10 分钟的摄取延迟。
storage 指标集带有一个预定义的仪表板

Google Cloud Platform 模块支持在模块中描述的标准配置选项。这是一个配置示例
metricbeat.modules:
- module: gcp
  metricsets:
    - compute
  region: "us-"
  project_id: "your project id"
  credentials_file_path: "your JSON credentials file path"
  exclude_labels: false
  period: 1m

- module: gcp
  metricsets:
    - pubsub
    - loadbalancing
    - firestore
    - dataproc
  zone: "us-central1-a"
  project_id: "your project id"
  credentials_file_path: "your JSON credentials file path"
  exclude_labels: false
  period: 1m

- module: gcp
  metricsets:
    - storage
  project_id: "your project id"
  credentials_file_path: "your JSON credentials file path"
  exclude_labels: false
  period: 5m

- module: gcp
  metricsets:
    - metrics
  project_id: "your project id"
  credentials_file_path: "your JSON credentials file path"
  exclude_labels: false
  period: 1m
  location_label: "resource.labels.zone"
  metrics:
    - aligner: ALIGN_NONE
      service: compute
      metric_types:
        - "instance/cpu/reserved_cores"
        - "instance/cpu/usage_time"
        - "instance/cpu/utilization"
        - "instance/uptime"

- module: gcp
  metricsets:
    - gke
  project_id: "your project id"
  credentials_file_path: "your JSON credentials file path"
  exclude_labels: false
  period: 1m

- module: gcp
  metricsets:
    - billing
  period: 24h
  project_id: "your project id"
  credentials_file_path: "your JSON credentials file path"
  dataset_id: "dataset id"
  table_pattern: "table pattern"
  cost_type: "regular"

- module: gcp
  metricsets:
    - carbon
  period: 24h
  project_id: "your project id"
  credentials_file_path: "your JSON credentials file path"
  endpoint: https://your-endpoint
  dataset_id: "dataset id"
  table_pattern: "table pattern"
以下指标集可用