Prometheus 监控
大规模分析您的 Prometheus 指标
Prometheus + Elasticsearch
为容器和 Kubernetes 实现全球化、可扩展且安全的 Prometheus 监控。将您的 Prometheus 指标发送到 Elasticsearch,并将其与您的日志和 APM 数据统一起来,以提高开源的可观测性。
支持 OpenMetrics
将更多部署迁移到云?Elastic Stack 可以像处理任何其他索引一样处理云原生指标。随着 OpenMetrics 继续标准化指标数据的公开方式,我们专注于简化收集所有指标以进行统一分析的体验。

从指标扩展到可观测性
以您希望的方式在 Elasticsearch 中聚合、关联和可视化您的所有运营数据。Prometheus 指标只是使您的容器和集群可观测的一部分。通过将您的 Prometheus 数据与日志和跟踪结合在一起,避免运营孤岛。了解更多关于使用 Elastic Stack 进行可观测性的信息。观看如何使用日志和 APM 数据增强 Prometheus 指标。

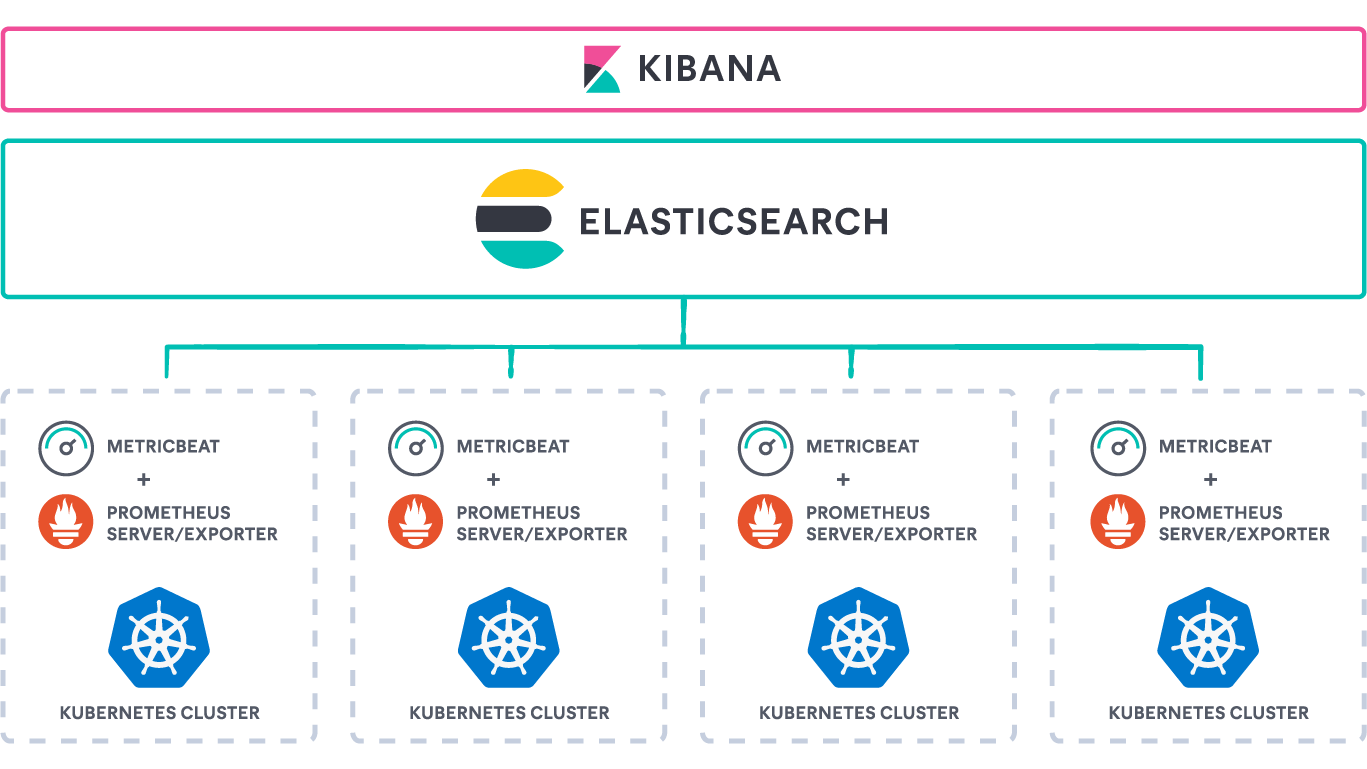
只需配置一个集中的全局视图
使用多个 Prometheus 服务器监控 Kubernetes 集群?没问题。整合来自数百个 Prometheus 实例的数据,并通过即插即用体验获得来自所有端点的全局数据视图。
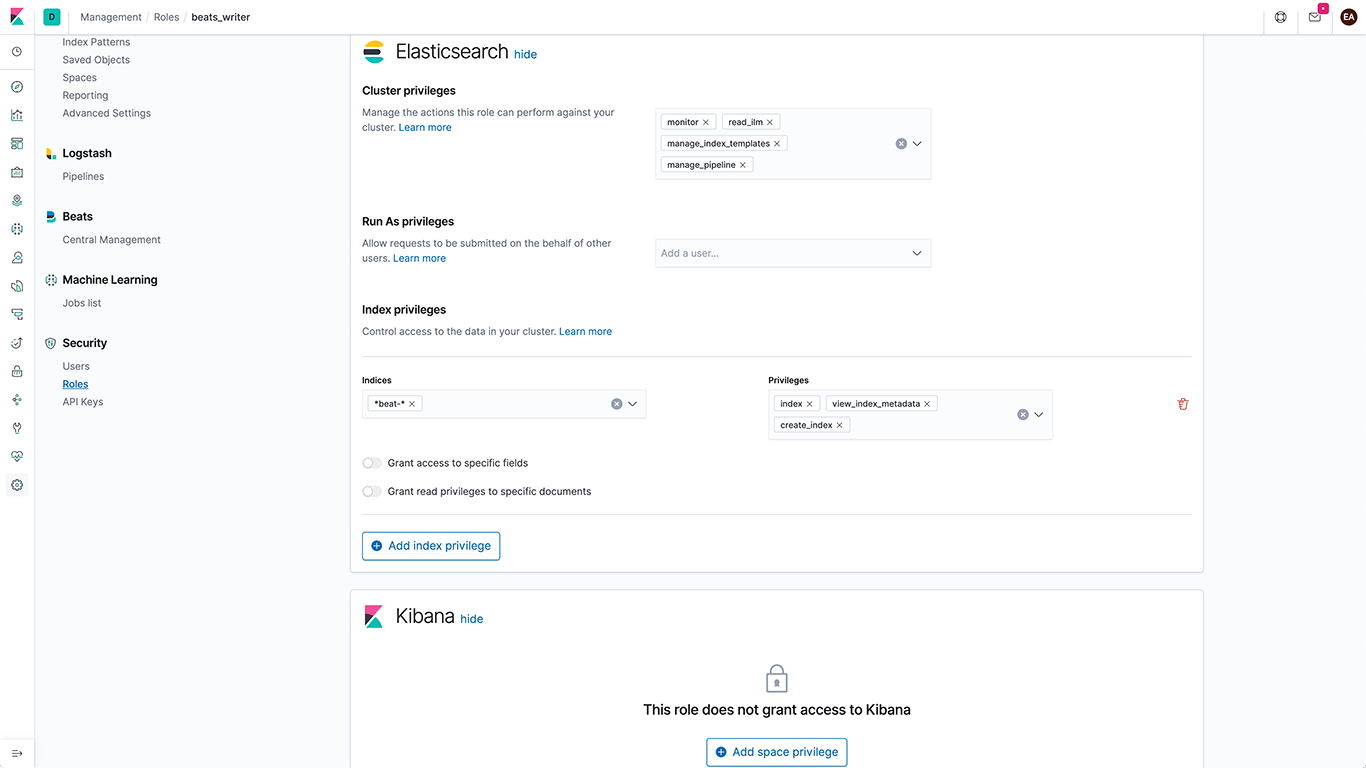
强大的安全性
使用基于角色和基于属性的访问控制,对您的 Prometheus 指标和其他运营数据进行微调权限。使用 Elastic,您可以放心,无论您的环境有多大和分布有多广,您的数据都可以安全地传输。了解更多关于 用户授权、TLS 和 Elastic 中的其他安全功能的信息。
开始将 Prometheus 指标发送到 Elasticsearch
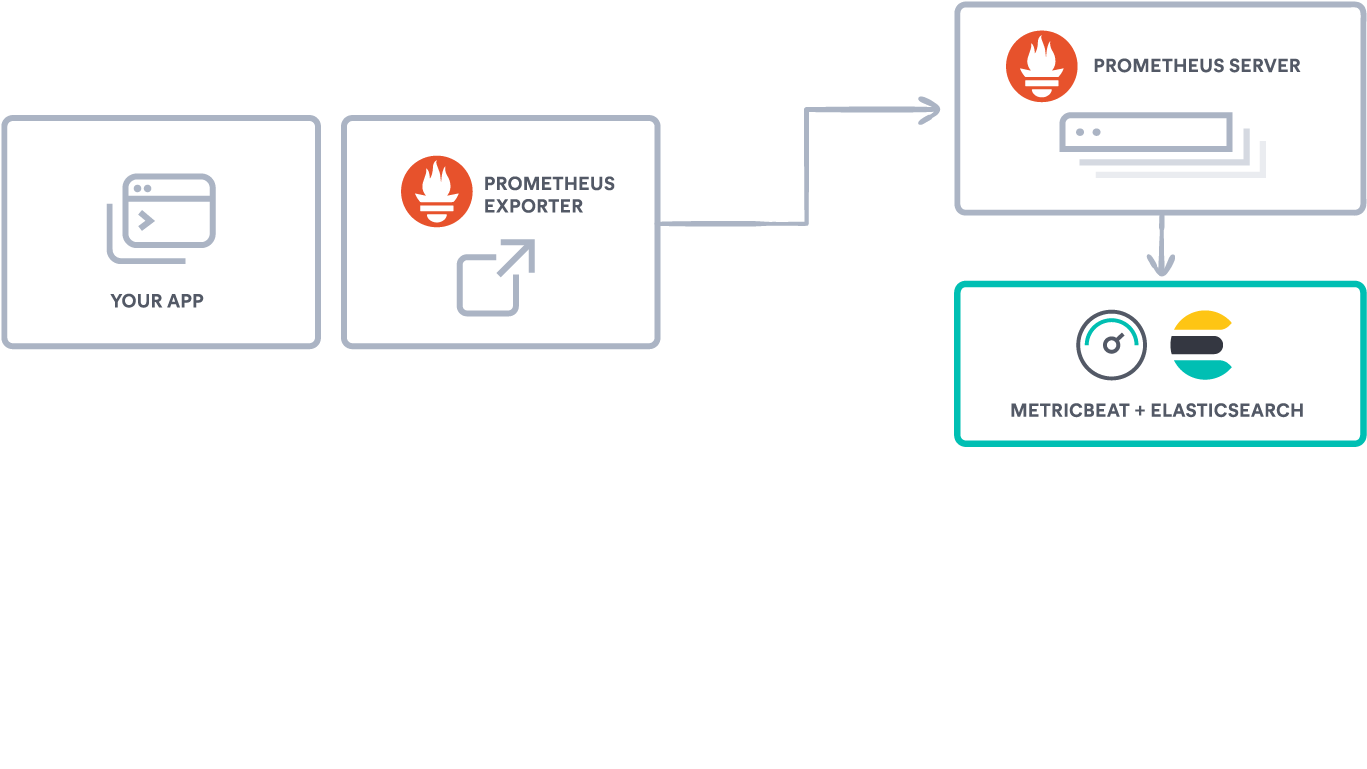
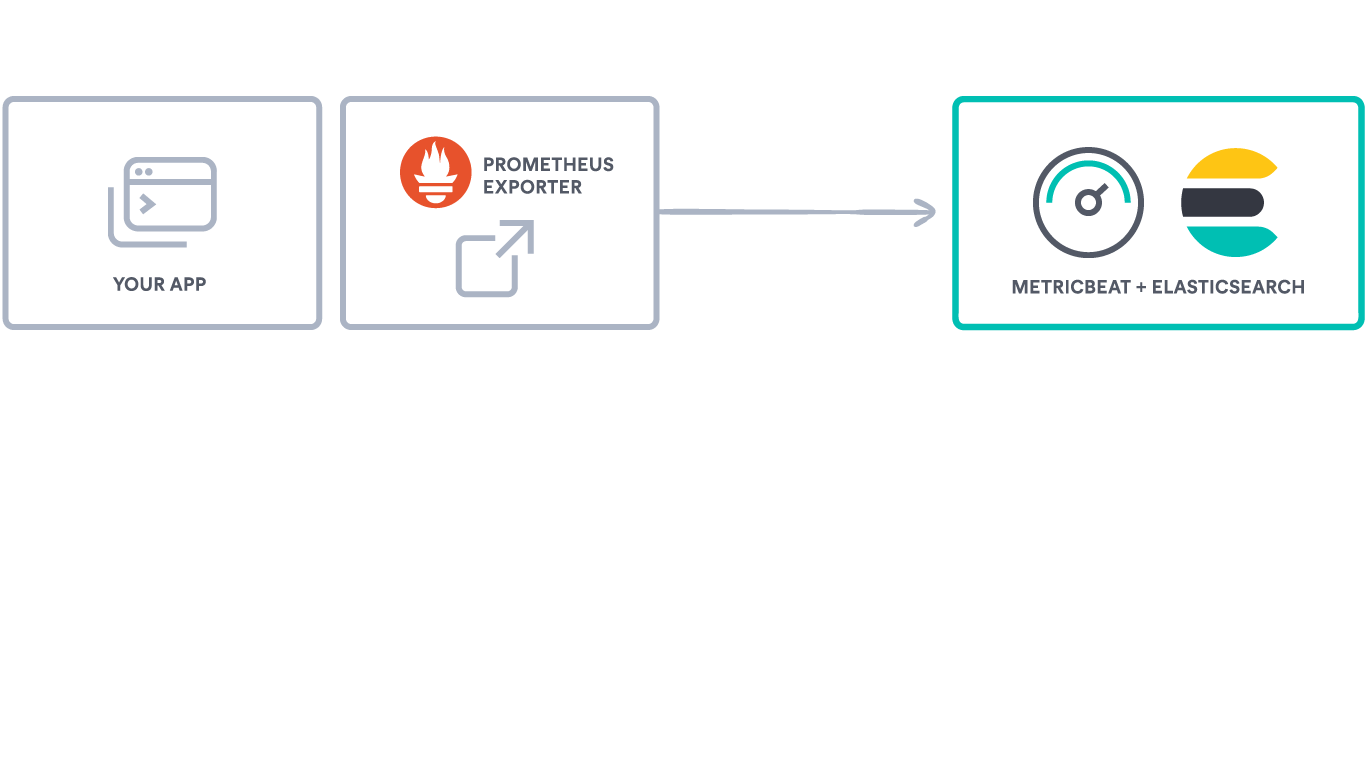
使用 Metricbeat 的 Prometheus 模块捕获和发送指标。