- Metricbeat 参考文档其他版本
- Metricbeat 概述
- 快速入门:安装和配置
- 设置并运行
- 升级 Metricbeat
- Metricbeat 的工作原理
- 配置
- 模块
- 常规设置
- 项目路径
- 配置文件加载
- 输出
- Kerberos
- SSL
- 索引生命周期管理 (ILM)
- Elasticsearch 索引模板
- Kibana 端点
- Kibana 仪表板
- 处理器
- 定义处理器
- add_cloud_metadata
- add_cloudfoundry_metadata
- add_docker_metadata
- add_fields
- add_host_metadata
- add_id
- add_kubernetes_metadata
- add_labels
- add_locale
- add_network_direction
- add_nomad_metadata
- add_observer_metadata
- add_process_metadata
- add_tags
- append
- community_id
- convert
- copy_fields
- decode_base64_field
- decode_duration
- decode_json_fields
- decode_xml
- decode_xml_wineventlog
- decompress_gzip_field
- detect_mime_type
- dissect
- dns
- drop_event
- drop_fields
- extract_array
- fingerprint
- include_fields
- move_fields
- rate_limit
- registered_domain
- rename
- replace
- script
- syslog
- translate_ldap_attribute
- translate_sid
- truncate_fields
- urldecode
- 自动发现
- 内部队列
- 日志
- HTTP 端点
- 正则表达式支持
- 检测
- 功能标志
- metricbeat.reference.yml
- 操作指南
- 模块
- ActiveMQ 模块
- Aerospike 模块
- Airflow 模块
- Apache 模块
- AWS 模块
- AWS Fargate 模块
- Azure 模块
- Beat 模块
- Ceph 模块
- Cloudfoundry 模块
- CockroachDB 模块
- Consul 模块
- Containerd 模块
- Coredns 模块
- Couchbase 模块
- CouchDB 模块
- Docker 模块
- Dropwizard 模块
- Elasticsearch 模块
- Elasticsearch ccr 指标集
- Elasticsearch cluster_stats 指标集
- Elasticsearch enrich 指标集
- Elasticsearch index 指标集
- Elasticsearch index_recovery 指标集
- Elasticsearch index_summary 指标集
- Elasticsearch ingest_pipeline 指标集
- Elasticsearch ml_job 指标集
- Elasticsearch node 指标集
- Elasticsearch node_stats 指标集
- Elasticsearch pending_tasks 指标集
- Elasticsearch shard 指标集
- Enterprise Search 模块
- Envoyproxy 模块
- Etcd 模块
- Google Cloud Platform 模块
- Google Cloud Platform billing 指标集
- Google Cloud Platform carbon 指标集
- Google Cloud Platform compute 指标集
- Google Cloud Platform dataproc 指标集
- Google Cloud Platform firestore 指标集
- Google Cloud Platform gke 指标集
- Google Cloud Platform loadbalancing 指标集
- Google Cloud Platform metrics 指标集
- Google Cloud Platform pubsub 指标集
- Google Cloud Platform storage 指标集
- Golang 模块
- Graphite 模块
- HAProxy 模块
- HTTP 模块
- IBM MQ 模块
- IIS 模块
- Istio 模块
- Jolokia 模块
- Kafka 模块
- Kibana 模块
- Kubernetes 模块
- Kubernetes apiserver 指标集
- Kubernetes container 指标集
- Kubernetes controllermanager 指标集
- Kubernetes event 指标集
- Kubernetes node 指标集
- Kubernetes pod 指标集
- Kubernetes proxy 指标集
- Kubernetes scheduler 指标集
- Kubernetes state_container 指标集
- Kubernetes state_cronjob 指标集
- Kubernetes state_daemonset 指标集
- Kubernetes state_deployment 指标集
- Kubernetes state_job 指标集
- Kubernetes state_node 指标集
- Kubernetes state_persistentvolumeclaim 指标集
- Kubernetes state_pod 指标集
- Kubernetes state_replicaset 指标集
- Kubernetes state_resourcequota 指标集
- Kubernetes state_service 指标集
- Kubernetes state_statefulset 指标集
- Kubernetes state_storageclass 指标集
- Kubernetes system 指标集
- Kubernetes volume 指标集
- KVM 模块
- Linux 模块
- Logstash 模块
- Memcached 模块
- Cisco Meraki 模块
- MongoDB 模块
- MSSQL 模块
- Munin 模块
- MySQL 模块
- NATS 模块
- Nginx 模块
- Openmetrics 模块
- Oracle 模块
- Panw 模块
- PHP_FPM 模块
- PostgreSQL 模块
- Prometheus 模块
- RabbitMQ 模块
- Redis 模块
- Redis Enterprise 模块
- SQL 模块
- Stan 模块
- Statsd 模块
- SyncGateway 模块
- System 模块
- System core 指标集
- System cpu 指标集
- System diskio 指标集
- System entropy 指标集
- System filesystem 指标集
- System fsstat 指标集
- System load 指标集
- System memory 指标集
- System network 指标集
- System network_summary 指标集
- System process 指标集
- System process_summary 指标集
- System raid 指标集
- System service 指标集
- System socket 指标集
- System socket_summary 指标集
- System uptime 指标集
- System users 指标集
- Tomcat 模块
- Traefik 模块
- uWSGI 模块
- vSphere 模块
- Windows 模块
- ZooKeeper 模块
- 导出的字段
- ActiveMQ 字段
- Aerospike 字段
- Airflow 字段
- Apache 字段
- AWS 字段
- AWS Fargate 字段
- Azure 字段
- Beat 字段
- Beat 字段
- Ceph 字段
- 云提供商元数据字段
- Cloudfoundry 字段
- CockroachDB 字段
- 通用字段
- Consul 字段
- Containerd 字段
- Coredns 字段
- Couchbase 字段
- CouchDB 字段
- Docker 字段
- Docker 字段
- Dropwizard 字段
- ECS 字段
- Elasticsearch 字段
- Enterprise Search 字段
- Envoyproxy 字段
- Etcd 字段
- Google Cloud Platform 字段
- Golang 字段
- Graphite 字段
- HAProxy 字段
- 主机字段
- HTTP 字段
- IBM MQ 字段
- IIS 字段
- Istio 字段
- Jolokia 字段
- Jolokia Discovery 自动发现提供程序字段
- Kafka 字段
- Kibana 字段
- Kubernetes 字段
- Kubernetes 字段
- KVM 字段
- Linux 字段
- Logstash 字段
- Memcached 字段
- MongoDB 字段
- MSSQL 字段
- Munin 字段
- MySQL 字段
- NATS 字段
- Nginx 字段
- Openmetrics 字段
- Oracle 字段
- Panw 字段
- PHP_FPM 字段
- PostgreSQL 字段
- 进程字段
- Prometheus 字段
- Prometheus 类型指标字段
- RabbitMQ 字段
- Redis 字段
- Redis Enterprise 字段
- SQL 字段
- Stan 字段
- Statsd 字段
- SyncGateway 字段
- 系统字段
- Tomcat 字段
- Traefik 字段
- uWSGI 字段
- vSphere 字段
- Windows 字段
- ZooKeeper 字段
- 监控
- 安全
- 故障排除
- 获取帮助
- 调试
- 了解已记录的指标
- 常见问题
- FreeBSD 上出现“open /compat/linux/proc: no such file or directory”错误
- Metricbeat 为您未配置的接口收集系统指标
- Metricbeat 使用过多带宽
- 加载配置文件时出错
- 发现意外或未知字符
- Logstash 连接不起作用
- 发布到 Logstash 失败,并显示“connection reset by peer”消息
- @metadata 在 Logstash 中丢失
- 不确定是使用 Logstash 还是 Beats
- SSL 客户端无法连接到 Logstash
- 监控 UI 显示的 Beats 比预期的少
- 仪表板无法找到索引模式
- 由于 MADV 设置导致 RSS 内存使用量过高
- 为 Beats 做出贡献
AWS rds 指标集
编辑AWS rds 指标集
编辑aws 模块的 rds 指标集允许您监控您的 AWS RDS 服务。rds 指标集从 Amazon RDS 和 Amazon Aurora 数据库获取一组指标。 使用 Amazon RDS,用户可以监控其数据库实例的网络吞吐量、读取、写入和/或元数据操作的 I/O、客户端连接以及突发积分余额。 Amazon RDS 每分钟都会将指标和维度发送到 Amazon CloudWatch。 Amazon Aurora 提供了各种 Amazon CloudWatch 指标,用户可以使用这些指标来监控 Aurora 数据库集群的运行状况和性能。 此指标集默认从 AWS RDS 收集所有标签。
AWS 权限
编辑IAM 用户需要一些特定的 AWS 权限才能收集 AWS RDS 指标。
cloudwatch:GetMetricData
ec2:DescribeRegions
rds:DescribeDBInstances
rds:ListTagsForResource
sts:GetCallerIdentity
iam:ListAccountAliases
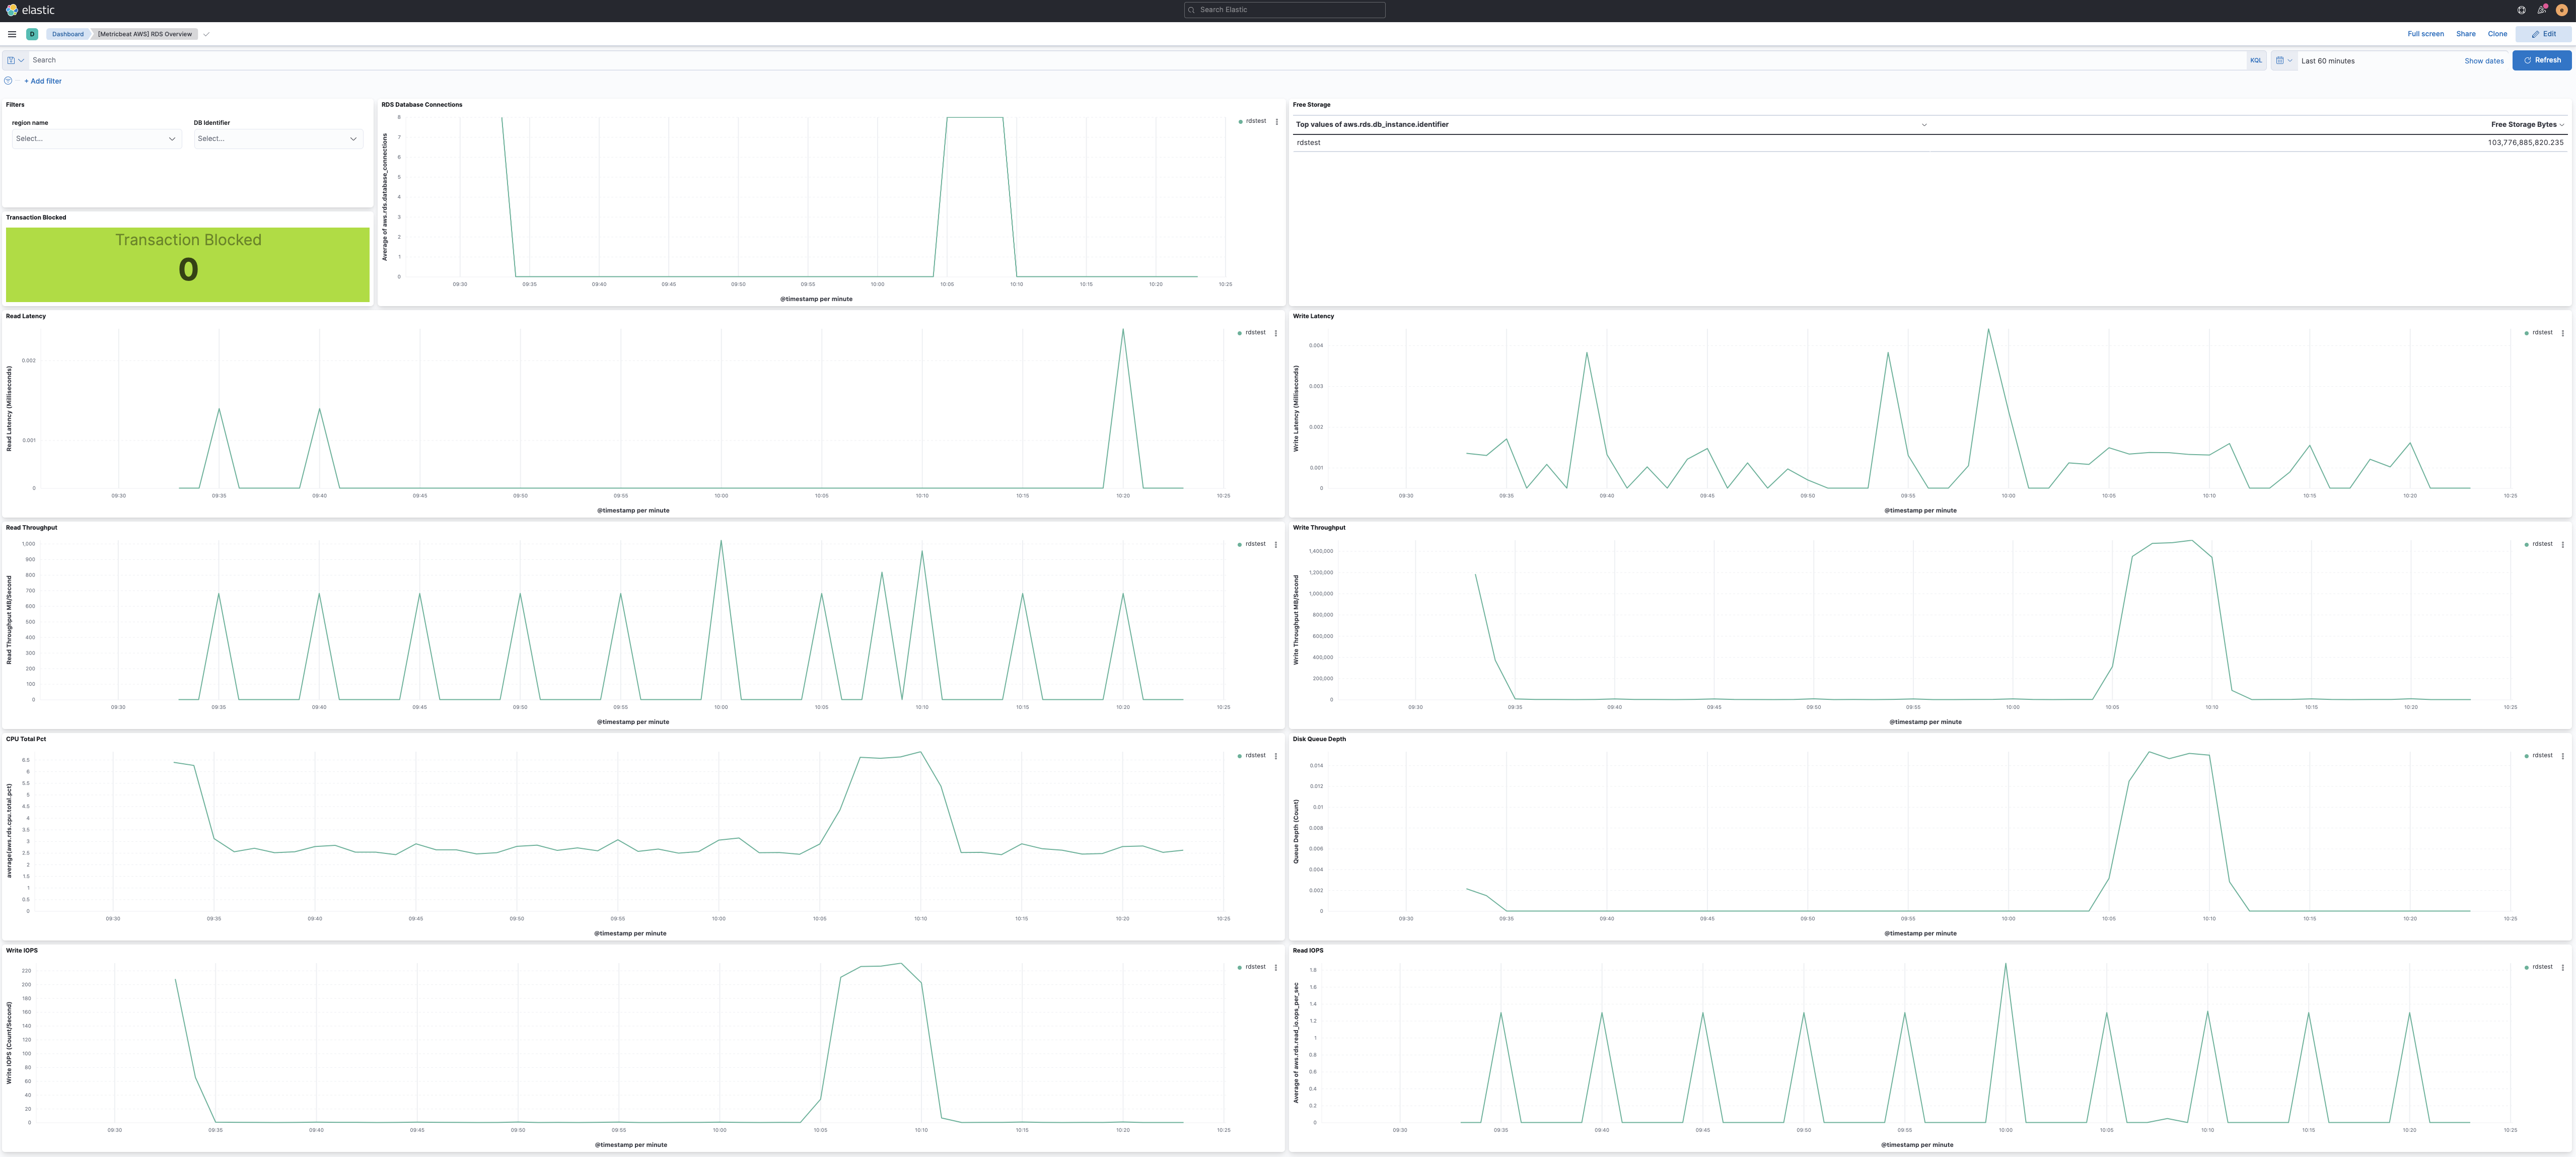
仪表板
编辑aws rds 指标集附带一个预定义的仪表板。
配置示例
编辑- module: aws period: 60s metricsets: - rds access_key_id: '<access_key_id>' secret_access_key: '<secret_access_key>' session_token: '<session_token>'
这是一个默认指标集。如果未配置 host 模块,则默认启用此指标集。
有关指标集中每个字段的描述,请参阅导出的字段部分。
以下是由此指标集生成的文档示例
{
    "@timestamp": "2017-10-12T08:05:34.853Z",
    "aws": {
        "cloudwatch": {
            "namespace": "AWS/RDS"
        },
        "dimensions": {
            "DatabaseClass": "db.r5.large"
        },
        "rds": {
            "aurora_bin_log_replica_lag": 0,
            "aurora_replica": {
                "lag": {
                    "ms": 19.9485
                },
                "lag_max": {
                    "ms": 21.318500518798828
                },
                "lag_min": {
                    "ms": 21.318500518798828
                }
            },
            "aurora_volume_left_total": {
                "bytes": 70007366615040
            },
            "cache_hit_ratio": {
                "buffer": 100,
                "result_set": 0
            },
            "cpu": {
                "total": {
                    "pct": 0.06552109062928828
                }
            },
            "database_connections": 0,
            "deadlocks": 0,
            "engine_uptime": {
                "sec": 33121208
            },
            "free_local_storage": {
                "bytes": 27275925504
            },
            "freeable_memory": {
                "bytes": 4604928000
            },
            "latency": {
                "commit": 3.2349916666666667,
                "ddl": 0,
                "delete": 0,
                "dml": 0.09888333333333334,
                "insert": 0.09888333333333334,
                "read": 0,
                "select": 0.2432811228126595,
                "update": 0,
                "write": 0.0005787267919438727
            },
            "login_failures": 0,
            "queries": 7.862475898034027,
            "throughput": {
                "commit": 0.24950762724254,
                "ddl": 0,
                "delete": 0,
                "dml": 0.24950762724254,
                "insert": 0.24950762724254,
                "network": 1.3985171580449323,
                "network_receive": 0.6992585790224661,
                "network_transmit": 0.6992585790224661,
                "select": 2.9299395125804084,
                "update": 0
            },
            "transactions": {
                "active": 0,
                "blocked": 0
            }
        }
    },
    "cloud": {
        "account": {
            "id": "428152502467",
            "name": "elastic-beats"
        },
        "provider": "aws",
        "region": "eu-west-1"
    },
    "event": {
        "dataset": "aws.rds",
        "duration": 115000,
        "module": "aws"
    },
    "metricset": {
        "name": "rds",
        "period": 10000
    },
    "service": {
        "type": "aws"
    }
}
Was this helpful?
Thank you for your feedback.