- Metricbeat 参考文档其他版本
- Metricbeat 概述
- 快速入门:安装和配置
- 设置并运行
- 升级 Metricbeat
- Metricbeat 的工作原理
- 配置
- 模块
- 常规设置
- 项目路径
- 配置文件加载
- 输出
- Kerberos
- SSL
- 索引生命周期管理 (ILM)
- Elasticsearch 索引模板
- Kibana 端点
- Kibana 仪表板
- 处理器
- 定义处理器
- add_cloud_metadata
- add_cloudfoundry_metadata
- add_docker_metadata
- add_fields
- add_host_metadata
- add_id
- add_kubernetes_metadata
- add_labels
- add_locale
- add_network_direction
- add_nomad_metadata
- add_observer_metadata
- add_process_metadata
- add_tags
- append
- community_id
- convert
- copy_fields
- decode_base64_field
- decode_duration
- decode_json_fields
- decode_xml
- decode_xml_wineventlog
- decompress_gzip_field
- detect_mime_type
- dissect
- dns
- drop_event
- drop_fields
- extract_array
- fingerprint
- include_fields
- move_fields
- rate_limit
- registered_domain
- rename
- replace
- script
- syslog
- translate_ldap_attribute
- translate_sid
- truncate_fields
- urldecode
- 自动发现
- 内部队列
- 日志
- HTTP 端点
- 正则表达式支持
- 检测
- 功能标志
- metricbeat.reference.yml
- 操作指南
- 模块
- ActiveMQ 模块
- Aerospike 模块
- Airflow 模块
- Apache 模块
- AWS 模块
- AWS Fargate 模块
- Azure 模块
- Beat 模块
- Ceph 模块
- Cloudfoundry 模块
- CockroachDB 模块
- Consul 模块
- Containerd 模块
- Coredns 模块
- Couchbase 模块
- CouchDB 模块
- Docker 模块
- Dropwizard 模块
- Elasticsearch 模块
- Elasticsearch ccr 指标集
- Elasticsearch cluster_stats 指标集
- Elasticsearch enrich 指标集
- Elasticsearch index 指标集
- Elasticsearch index_recovery 指标集
- Elasticsearch index_summary 指标集
- Elasticsearch ingest_pipeline 指标集
- Elasticsearch ml_job 指标集
- Elasticsearch node 指标集
- Elasticsearch node_stats 指标集
- Elasticsearch pending_tasks 指标集
- Elasticsearch shard 指标集
- Enterprise Search 模块
- Envoyproxy 模块
- Etcd 模块
- Google Cloud Platform 模块
- Google Cloud Platform billing 指标集
- Google Cloud Platform carbon 指标集
- Google Cloud Platform compute 指标集
- Google Cloud Platform dataproc 指标集
- Google Cloud Platform firestore 指标集
- Google Cloud Platform gke 指标集
- Google Cloud Platform loadbalancing 指标集
- Google Cloud Platform metrics 指标集
- Google Cloud Platform pubsub 指标集
- Google Cloud Platform storage 指标集
- Golang 模块
- Graphite 模块
- HAProxy 模块
- HTTP 模块
- IBM MQ 模块
- IIS 模块
- Istio 模块
- Jolokia 模块
- Kafka 模块
- Kibana 模块
- Kubernetes 模块
- Kubernetes apiserver 指标集
- Kubernetes container 指标集
- Kubernetes controllermanager 指标集
- Kubernetes event 指标集
- Kubernetes node 指标集
- Kubernetes pod 指标集
- Kubernetes proxy 指标集
- Kubernetes scheduler 指标集
- Kubernetes state_container 指标集
- Kubernetes state_cronjob 指标集
- Kubernetes state_daemonset 指标集
- Kubernetes state_deployment 指标集
- Kubernetes state_job 指标集
- Kubernetes state_node 指标集
- Kubernetes state_persistentvolumeclaim 指标集
- Kubernetes state_pod 指标集
- Kubernetes state_replicaset 指标集
- Kubernetes state_resourcequota 指标集
- Kubernetes state_service 指标集
- Kubernetes state_statefulset 指标集
- Kubernetes state_storageclass 指标集
- Kubernetes system 指标集
- Kubernetes volume 指标集
- KVM 模块
- Linux 模块
- Logstash 模块
- Memcached 模块
- Cisco Meraki 模块
- MongoDB 模块
- MSSQL 模块
- Munin 模块
- MySQL 模块
- NATS 模块
- Nginx 模块
- Openmetrics 模块
- Oracle 模块
- Panw 模块
- PHP_FPM 模块
- PostgreSQL 模块
- Prometheus 模块
- RabbitMQ 模块
- Redis 模块
- Redis Enterprise 模块
- SQL 模块
- Stan 模块
- Statsd 模块
- SyncGateway 模块
- System 模块
- System core 指标集
- System cpu 指标集
- System diskio 指标集
- System entropy 指标集
- System filesystem 指标集
- System fsstat 指标集
- System load 指标集
- System memory 指标集
- System network 指标集
- System network_summary 指标集
- System process 指标集
- System process_summary 指标集
- System raid 指标集
- System service 指标集
- System socket 指标集
- System socket_summary 指标集
- System uptime 指标集
- System users 指标集
- Tomcat 模块
- Traefik 模块
- uWSGI 模块
- vSphere 模块
- Windows 模块
- ZooKeeper 模块
- 导出的字段
- ActiveMQ 字段
- Aerospike 字段
- Airflow 字段
- Apache 字段
- AWS 字段
- AWS Fargate 字段
- Azure 字段
- Beat 字段
- Beat 字段
- Ceph 字段
- 云提供商元数据字段
- Cloudfoundry 字段
- CockroachDB 字段
- 通用字段
- Consul 字段
- Containerd 字段
- Coredns 字段
- Couchbase 字段
- CouchDB 字段
- Docker 字段
- Docker 字段
- Dropwizard 字段
- ECS 字段
- Elasticsearch 字段
- Enterprise Search 字段
- Envoyproxy 字段
- Etcd 字段
- Google Cloud Platform 字段
- Golang 字段
- Graphite 字段
- HAProxy 字段
- 主机字段
- HTTP 字段
- IBM MQ 字段
- IIS 字段
- Istio 字段
- Jolokia 字段
- Jolokia Discovery 自动发现提供程序字段
- Kafka 字段
- Kibana 字段
- Kubernetes 字段
- Kubernetes 字段
- KVM 字段
- Linux 字段
- Logstash 字段
- Memcached 字段
- MongoDB 字段
- MSSQL 字段
- Munin 字段
- MySQL 字段
- NATS 字段
- Nginx 字段
- Openmetrics 字段
- Oracle 字段
- Panw 字段
- PHP_FPM 字段
- PostgreSQL 字段
- 进程字段
- Prometheus 字段
- Prometheus 类型指标字段
- RabbitMQ 字段
- Redis 字段
- Redis Enterprise 字段
- SQL 字段
- Stan 字段
- Statsd 字段
- SyncGateway 字段
- 系统字段
- Tomcat 字段
- Traefik 字段
- uWSGI 字段
- vSphere 字段
- Windows 字段
- ZooKeeper 字段
- 监控
- 安全
- 故障排除
- 获取帮助
- 调试
- 了解已记录的指标
- 常见问题
- FreeBSD 上出现“open /compat/linux/proc: no such file or directory”错误
- Metricbeat 为您未配置的接口收集系统指标
- Metricbeat 使用过多带宽
- 加载配置文件时出错
- 发现意外或未知字符
- Logstash 连接不起作用
- 发布到 Logstash 失败,并显示“connection reset by peer”消息
- @metadata 在 Logstash 中丢失
- 不确定是使用 Logstash 还是 Beats
- SSL 客户端无法连接到 Logstash
- 监控 UI 显示的 Beats 比预期的少
- 仪表板无法找到索引模式
- 由于 MADV 设置导致 RSS 内存使用量过高
- 为 Beats 做出贡献
系统模块
编辑系统模块
编辑系统模块允许您监控服务器。由于系统模块始终应用于本地服务器,因此不需要 hosts 配置选项。
默认指标集为 cpu、load、memory、network、process、process_summary、socket_summary、filesystem、fsstat 和 uptime。要禁用默认指标集,请在 modules.d/system.yml 配置文件中将其注释掉。如果 _所有_ 指标集都被注释掉并且系统模块已启用,则 Metricbeat 将使用默认指标集。
请注意,某些指标集可能会访问 /proc 以收集进程信息,并且内核调用 ptrace_may_access() 来检查权限可能会被 AppArmor 和其他 LSM 软件阻止,即使系统模块不直接使用 ptrace。
指标的收集方式和时间
系统模块监控的某些指标需要收集多个值。例如,system.process.cpu.total.norm.pct 字段报告进程自上次事件以来花费的 CPU 时间百分比。要确定此百分比,进程需要至少出现两次,以便可以计算性能增量。
请注意,在某些情况下,如果进程的可用时间不足以包含在两个指标收集周期中,则系统模块指标集中可能会缺少此类字段。
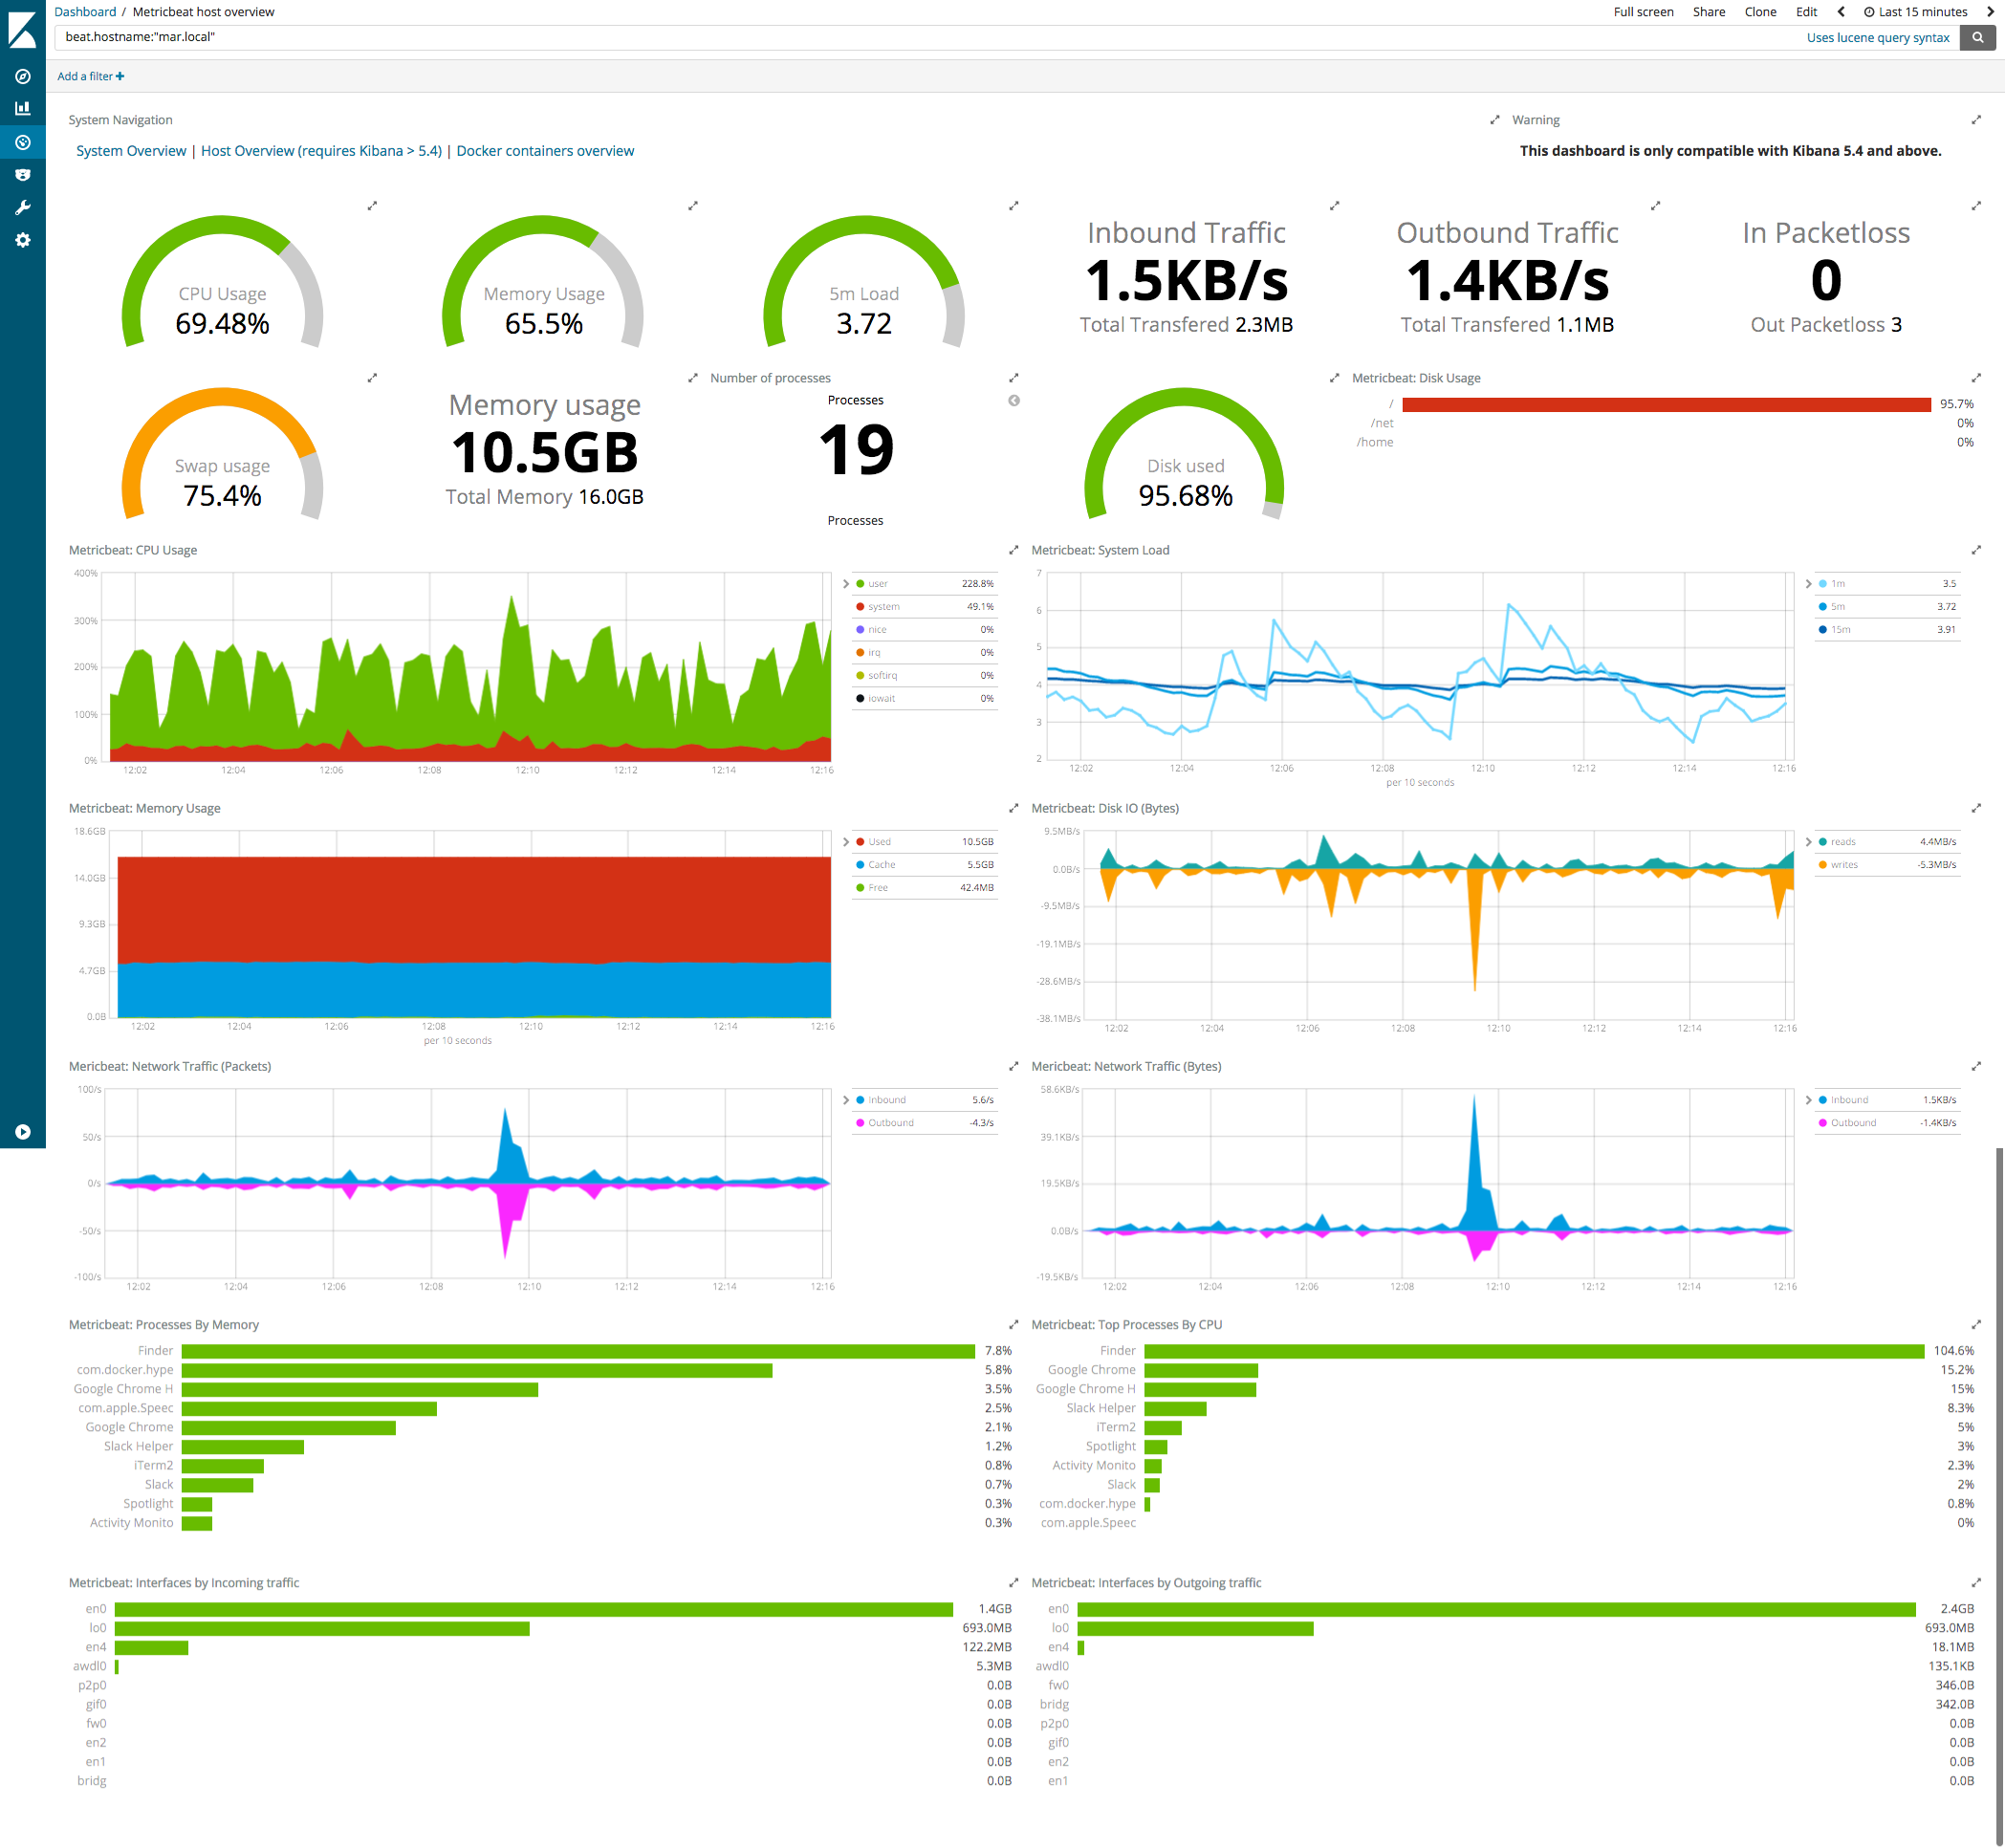
仪表盘
编辑系统模块附带一个预定义的仪表盘。例如
所需权限
编辑系统指标集收集不同类型的指标数据,这可能需要专用的权限才能获取。出于安全原因,建议授予尽可能低的权限。本节阐述了特定指标集必须存在的权限。
请注意,现代 Linux 实现将传统上与超级用户关联的特权划分为不同的单元,称为能力,可以独立启用和禁用。能力是每个线程的属性。
cpu
编辑CPU 统计信息(空闲、irq、用户、系统、iowait、softirq、核心、nice、steal、total)应该在没有提升权限的情况下可用。
load
编辑CPU 负载数据(1 分钟、5 分钟、15 分钟、核心)应该在没有提升权限的情况下可用。
memory
编辑内存统计信息(交换、总计、已用、可用、实际)应该在没有提升权限的情况下可用。
network
编辑接口的网络指标(输入、输出、错误、丢弃、字节、数据包)应该在没有提升权限的情况下可用。
process
编辑进程执行数据(状态、内存、cpu、cmdline)应该对授权用户可用。
如果 beats 进程以较低权限的用户身份运行,则可能无法读取属于其他用户的进程数据。该问题应在应用程序日志中报告
2019-12-23T13:32:06.457+0100 DEBUG [processes] process/process.go:475 Skip process pid=235: error getting process state for pid=235: Could not read process info for pid 23
process_summary
编辑常规进程摘要(未知、已终止、总计、睡眠、运行、空闲、停止、僵尸)应该在没有提升权限的情况下可用。请注意,如果进程数据属于其他用户,则它将被计为未知值(应用程序日志中不会报告任何错误)。
socket_summary
编辑已使用的套接字摘要(TCP、UDP、计数、侦听、已建立、等待等)应该在没有提升权限的情况下可用。
entropy
编辑熵数据(可用、池大小)需要访问 /proc/sys/kernel/random 路径。否则将报告错误。
core
编辑每个 CPU 核心的使用统计信息(空闲、irq、用户、系统、iowait、softirq、核心、nice、steal、total)应该在没有提升权限的情况下可用。
diskio
编辑磁盘 IO 指标(io、读取、写入)应该在没有提升权限的情况下可用。
socket
编辑每个新 TCP 套接字的事件应该对授权用户可用。
如果 beats 进程以较低权限的用户身份运行,则可能无法查看属于其他用户的套接字数据。
service
编辑Systemd 服务数据(内存、任务、状态)应该对授权用户可用。
如果 beats 进程以较低权限的用户身份运行,则可能无法读取属于其他用户的进程数据。该问题应在应用程序日志中报告
2020-01-02T08:19:50.635Z INFO module/wrapper.go:252 Error fetching data for metricset system.service: error getting list of running units: Rejected send message, 2 matched rules; type="method_call", sender=":1.35" (uid=1000 pid=4429 comm="./metricbeat -d * -e ") interface="org.freedesktop.systemd1.Manager" member="ListUnitsByPatterns" error name="(unset)" requested_reply="0" destination="org.freedesktop.systemd1" (uid=0 pid=1 comm="/usr/lib/systemd/systemd --switched-root --system ")
filesystem
编辑文件系统指标数据(总计、可用、类型、挂载点、文件、可用、已用)应该在没有提升权限的情况下可用。
fsstat
编辑Fsstat 指标数据(总大小、可用、总计、已用计数)应该在没有提升权限的情况下可用。
uptime
编辑正常运行时间指标数据(持续时间)应该在没有提升权限的情况下可用。
raid
编辑RAID 指标数据(块、磁盘)需要访问 /sys/block 挂载点和所有引用的设备。否则将报告错误。
系统模块支持 模块 中描述的标准配置选项。这是一个示例配置
metricbeat.modules:
- module: system
  metricsets:
    - cpu             # CPU usage
    - load            # CPU load averages
    - memory          # Memory usage
    - network         # Network IO
    - process         # Per process metrics
    - process_summary # Process summary
    - uptime          # System Uptime
    - socket_summary  # Socket summary
    #- core           # Per CPU core usage
    #- diskio         # Disk IO
    #- filesystem     # File system usage for each mountpoint
    #- fsstat         # File system summary metrics
    #- raid           # Raid
    #- socket         # Sockets and connection info (linux only)
    #- service        # systemd service information
  enabled: true
  period: 10s
  processes: ['.*']

  # Configure the mount point of the host’s filesystem for use in monitoring a host from within a container
  #hostfs: "/hostfs"

  # Configure the metric types that are included by these metricsets.
  cpu.metrics:  ["percentages","normalized_percentages"]  # The other available option is ticks.
  core.metrics: ["percentages"]  # The other available option is ticks.

  # A list of filesystem types to ignore. The filesystem metricset will not
  # collect data from filesystems matching any of the specified types, and
  # fsstats will not include data from these filesystems in its summary stats.
  # If not set, types associated to virtual filesystems are automatically
  # added when this information is available in the system (e.g. the list of
  # `nodev` types in `/proc/filesystem`).
  #filesystem.ignore_types: []

  # These options allow you to filter out all processes that are not
  # in the top N by CPU or memory, in order to reduce the number of documents created.
  # If both the `by_cpu` and `by_memory` options are used, the union of the two sets
  # is included.
  #process.include_top_n:

    # Set to false to disable this feature and include all processes
    #enabled: true

    # How many processes to include from the top by CPU. The processes are sorted
    # by the `system.process.cpu.total.pct` field.
    #by_cpu: 0

    # How many processes to include from the top by memory. The processes are sorted
    # by the `system.process.memory.rss.bytes` field.
    #by_memory: 0

  # If false, cmdline of a process is not cached.
  #process.cmdline.cache.enabled: true

  # Enable collection of cgroup metrics from processes on Linux.
  #process.cgroups.enabled: true

  # A list of regular expressions used to whitelist environment variables
  # reported with the process metricset's events. Defaults to empty.
  #process.env.whitelist: []

  # Include the cumulative CPU tick values with the process metrics. Defaults
  # to false.
  #process.include_cpu_ticks: false

  # Raid mount point to monitor
  #raid.mount_point: '/'

  # Configure reverse DNS lookup on remote IP addresses in the socket metricset.
  #socket.reverse_lookup.enabled: false
  #socket.reverse_lookup.success_ttl: 60s
  #socket.reverse_lookup.failure_ttl: 60s

  # Diskio configurations
  #diskio.include_devices: []

  # Filter systemd services by status or sub-status
  #service.state_filter: ["active"]

  # Filter systemd services based on a name pattern
  #service.pattern_filter: ["ssh*", "nfs*"]
以下指标集可用
On this page