Build tailored experiences with Elastic.
Scale your business with Elastic Partners
Search and analytics, data ingestion, and visualization – all at your fingertips.
By developers, for developers
Unlock the power of real-time insights with Elastic on your preferred cloud provider.
Prototype and integrate with LLMs faster using search AI.
Discover a world of AI possibilities — built with the power of search.
Protect, investigate, and respond to cyber threats with AI-driven security analytics.
Unify app and infrastructure visibility to proactively resolve issues.
See how customers search, solve, and succeed — all on one Search AI Platform.
Exceed customer expectations and go to market faster.
Cisco saves 5,000 support engineer hours per month
Sitecore automates 96 percent of security workflows with Elastic
Comcast transforms customer experiences with Elastic Observability
Stay at the forefront of innovation with technical tips from the experts.
Code with other developers to create a better Elastic, together.
Unleash the possibilities of your data and grow your skill set.
Keep informed about the latest tech and news from Elastic.
Have questions?
New
The executive guide to generative AI
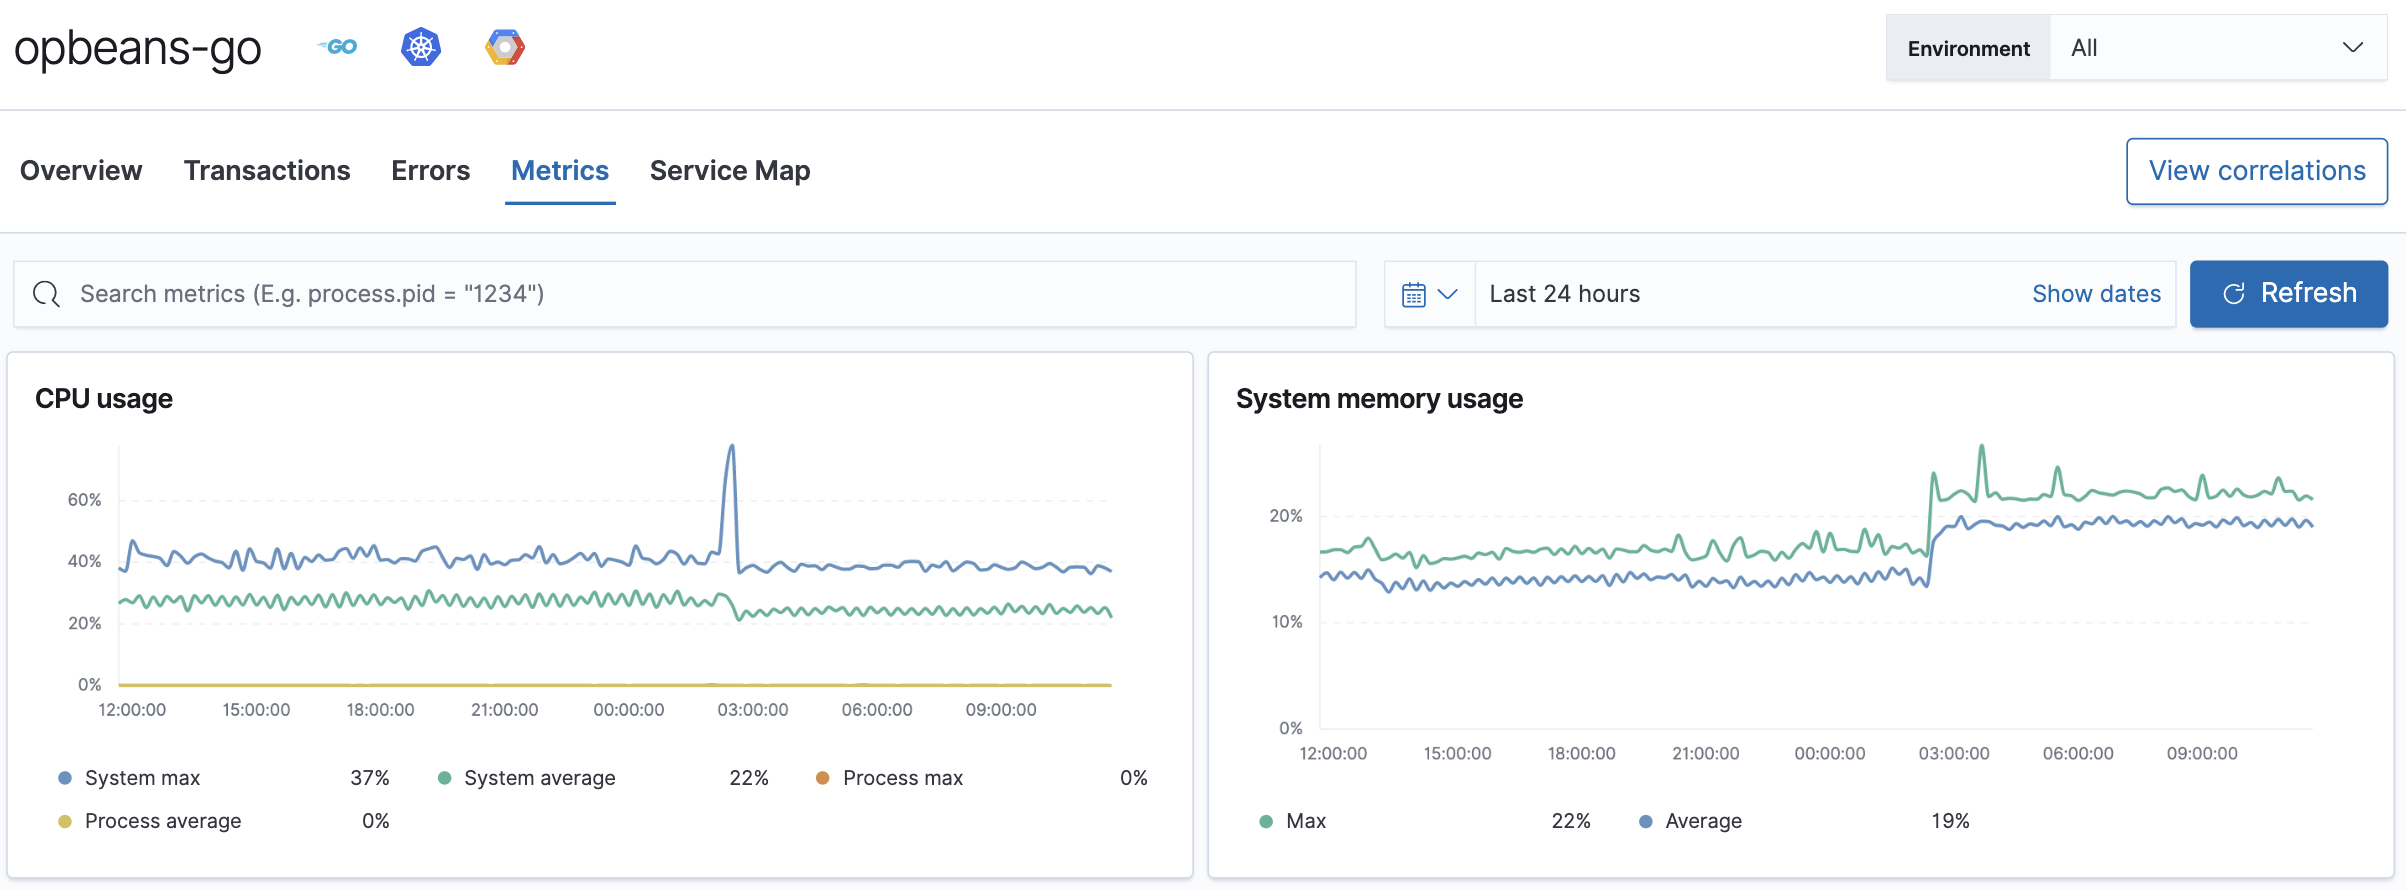
指标 概述提供了 APM 代理特定的指标,使您可以在应用程序 UI 中执行更深入的根本原因分析调查。
如果您的服务遇到问题,您可以使用此页面来尝试查找根本原因。例如,您可能可以将大量错误与较长的事务持续时间、较高的 CPU 使用率或内存泄漏相关联。
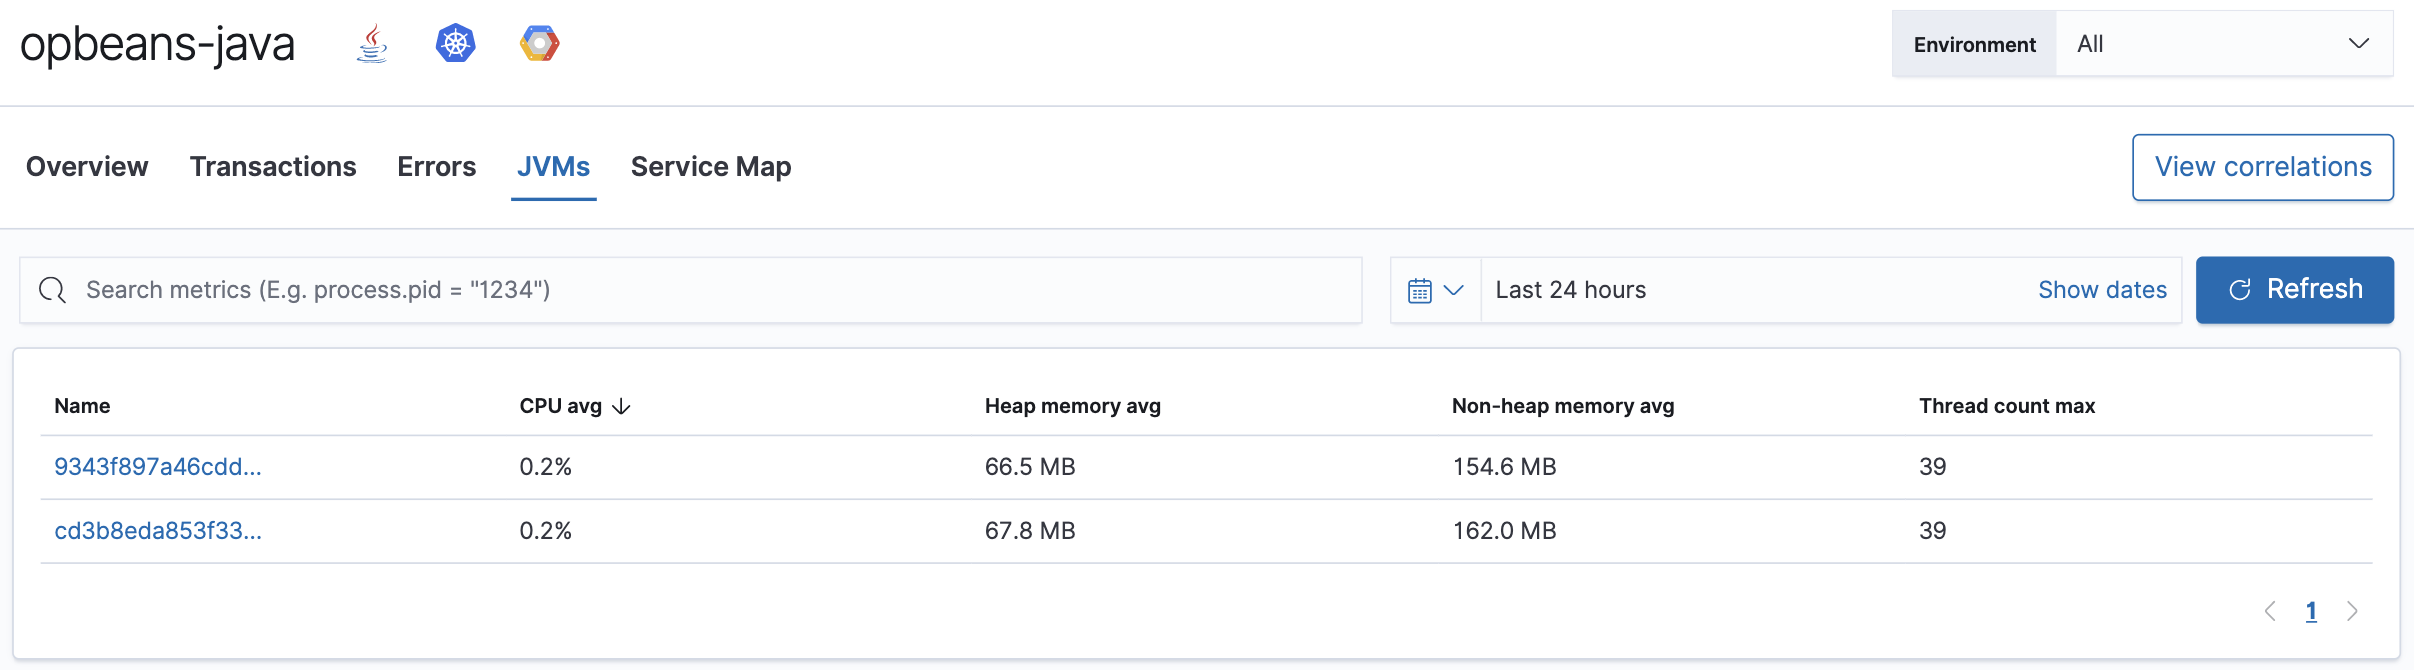
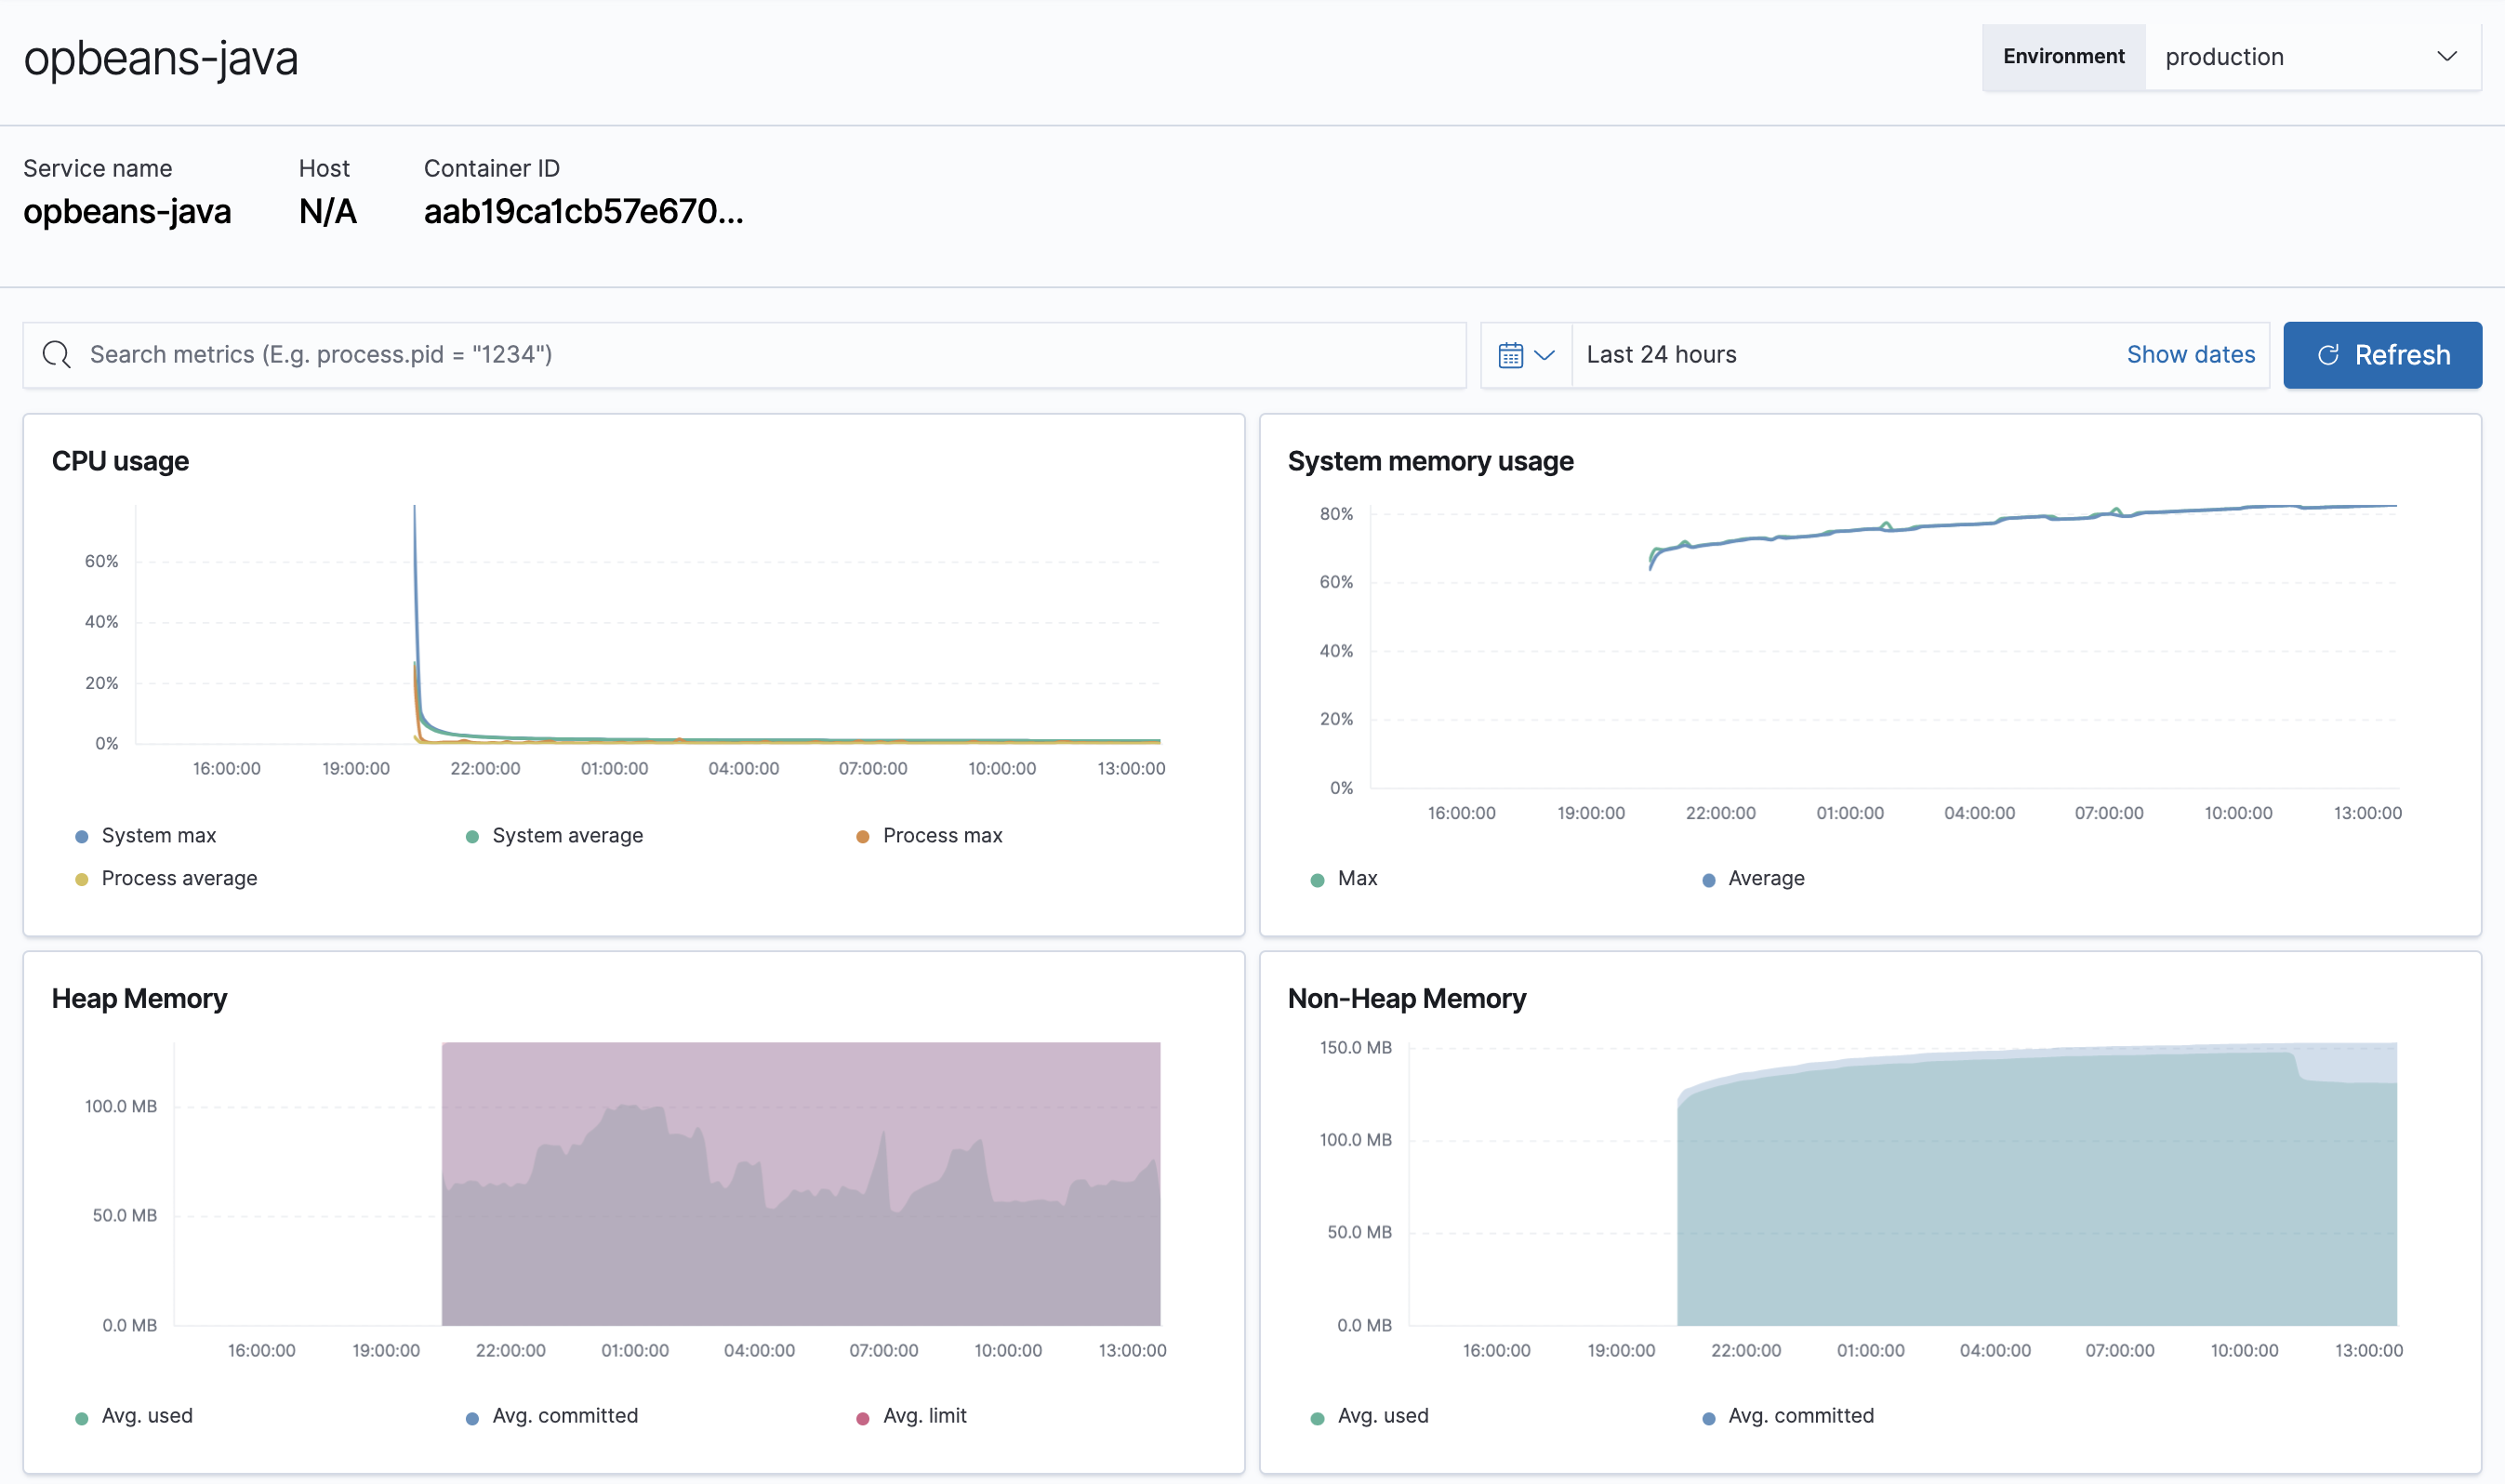
如果您正在使用 Java APM 代理,则可以查看每个 JVM 的指标。
按 JVM 分解指标可以更容易地分析提供的指标:CPU 使用率、内存使用率、堆或非堆内存、线程计数、垃圾回收率以及每分钟花费的垃圾回收时间。
最受欢迎
视频
开始使用 Elasticsearch
Kibana 简介
用于日志和指标的 ELK